I am trying to read histograms induced charge map in TRansientPropagation from a .root file. It gives me the following error
root [1] (TFile *) 0x5bdf130
Error in TBufferFile::CheckByteCount: object of class TH2D read too many bytes: 1600640735 instead of 526898911
Warning in TBufferFile::CheckByteCount: TH2D::Streamer() not in sync with data on file -300V_pulsgraph.root, fix Streamer()
Error in TBufferFile::CheckByteCount: object of class TH2D read too many bytes: 1600640735 instead of 526898911
Warning in TBufferFile::CheckByteCount: TH2D::Streamer() not in sync with data on file -300V_pulsgraph.root, fix Streamer()
also i saw a warning while executing the simulation which states that linear electric field can produce nonphysical results.
i am using a simple diode in TCT type setup to simulate the induced charge. the configuration files are attached.
i will be thankful for your tips.
Faiz
silicon.conf (3.2 KB)
silicon_detector.conf (116 Bytes)
diode_collimator.conf (356 Bytes)
-300V_pulsgraph.root (37.2 MB)
Dear @sakzai ,
it seems to me that the reason for this error could be that the number of entries or bins in the histograms are too large. In the first event I simulated, I already obtained 3 million charge carriers. The warning concerning the electric field is not an issue in terms of data processing.
My answer would be, that if you require exactly this configuration, I would advise you to use the output of the ROOTObjectWriter and generate the graphs you need in post-processing of the simulated data.
However, I noticed that you wrote " a simple diode in TCT type setup", but what your simulation does is placing an Americium isotope without kinetic energy into your sensor bulk. I’m not sure what processes this starts, but likely there will be a decay, maybe a recoil of the nucleus? Anyway, this doesn’t resemble a TCT setup. If you need hints on how to configure such a setup, please let us know.
Cheers
Paul
Hi @pschutze thank you very much for you kind comments and feedback. I will follow your advise and use the ROOTObjectWriter output as input for getting the graphs.
Of course i will be very happy having hints and your guidance on proper TCT setup. Here, i am trying TCT simulation with alpha particles generated by Am-241 alpha source. Alpha source laid just near to one z-surface of the bulk volume (but not in the bulk as to my restricted knowledge) and emitting alpha particles with energy above 6MeV (I am not sure about the exact amount of energy at the moment but it is round about 6MeV). The emitted particles then deposits its energy to the bulk material near to the bulk surface probably penetrates not more than 10um in the bulk. In lab, contrast to laser and other sources, it is preferable to use alpha because it provides the opportunity to observe mobilities and other related characteristics only for e or h because one type of charge carrier is always so near to the surface that it does not practically contribute to the signal generated. In my case i am interested to study mobilities and and other drift charactristics individually for e and h in diamond. I may be wrong, but it is what i am doing at the moment and i will be very happy and thankful for your feedback and guidance.
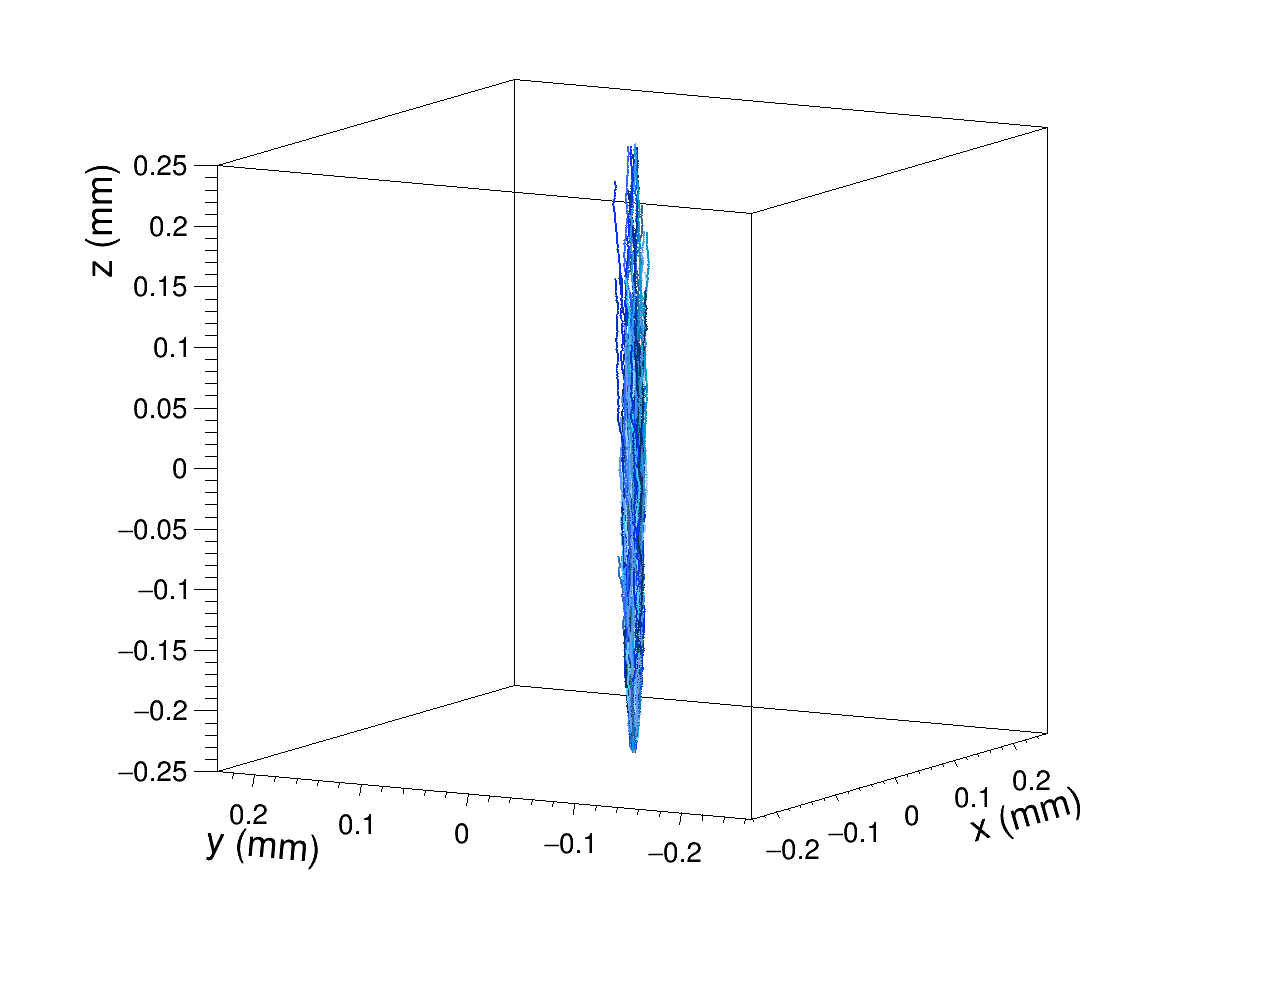
Attached with this the linegraph that shows the position and drift of electrons through bulk for deposition of energy by one particle.
kind regards Faiz
Dear @sakzai ,
please apologise, I have looked at the configurations again and I was wrong with what I said yesterday. Indeed, of course the source is outside your sensor. Hence, your setup is totally fine. I’m sorry if I caused any irritations.
Now, it took me a bit to find the issue you’re facing, and I was a bit blinded by the large charge depositions you get. The issue however is a totally different one: the graphs that show a map of the induced charge are hardcoded to have a number of bins equal to the pixel pitch given in micrometers, see here. With the diode you’re simulating, this will be 10000 x 10000 bins, which is simply too much for ROOT, as ferhue pointed out in his post in the ROOT Forum.
The cures for this are quite simple:
Option A: you reduce the size of the diode. This might not be preferred as you might use this size for a good reason
Option B: you alter the histogram binning in the source code and recompile Allpix Squared.
In the meantime, we will discuss whether adding a safety mechanism here to avoid this error would be appropriate.
Please let us know if you need any further assistance.
Cheers
Paul
Dear @pschutze
It is no problem at all, I am very happy and comfortable with these conversations and of course learning. Thank you for the hints, i will try now these options and will see what happens.
update-1: So i have some thing like this. sorry Paul for my stupid question but i didn’t understand the depth verses time concept of induced charge. The histogram is a black output (certainty i will go to your first advice, reprocessing the data from ROOTOjectWriter, but i think it should be a little better here than what what does it show)
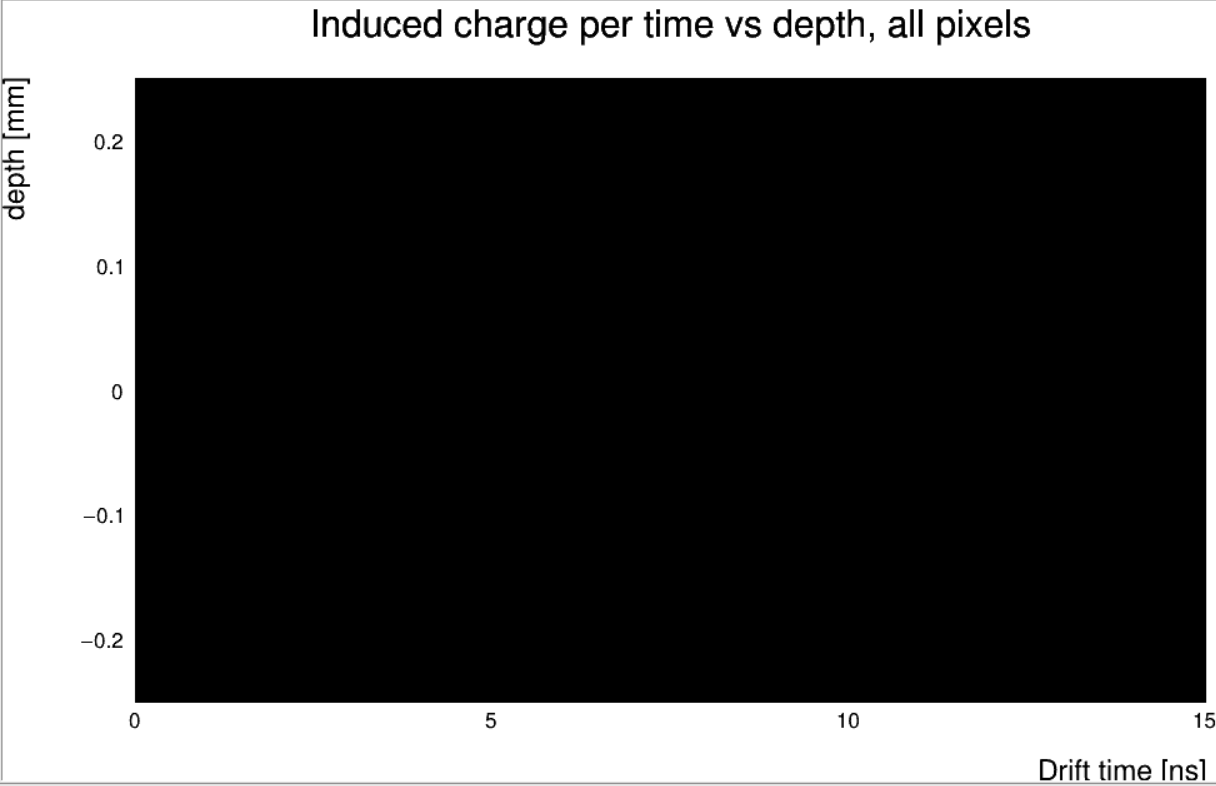
Update-2: after reading trees from .root file using ROOTObjectReader, i have the same black histogram.
regards,
Faiz
Hi @sakzai
change your plotting style to colz to get a rendering with colored z-axis. Top-left corner of the ROOT browser.
/Simon
change your plotting style to
colzto get a rendering with colored z-axis. Top-left corner of the ROOT browser.
… or in case you’re using ROOT from a script or command line, it’s name_of_histogram->Draw("colz");