Hi all,
I want to obtain time dependent signals from CSADigitizer by following Obtaining time dependent signals from CSADigitizer.
I also borrowed the default detector configuration example.conf in code repository, where I replaced the default propagation, transfer and digitizer with TransientPropagation + PulseTransfer + CSADigitizer.
I planned to collect the PixelPulse objects from PixelHit trees. But it said that it could not read tree PixelHit when I parsed the File00000.root.
I attached the example.conf file. Many thanks.
[Allpix]
log_level = “INFO”
log_format = “DEFAULT”
detectors_file = “example_detector.conf”
number_of_events = 10000
[GeometryBuilderGeant4]
[DepositionGeant4]
physics_list = FTFP_BERT_LIV
particle_type = “Pi+”
source_energy = 120GeV
source_position = 33um 66um -500um
source_type = “beam”
beam_size = 10um
beam_direction = 0 0 1
number_of_particles = 1
max_step_length = 1um
[ElectricFieldReader]
model = “mesh”
file_name = “example_electric_field.init”
field_mapping = PIXEL_FULL
[WeightingPotentialReader]
model = “pad”
output_plots=true
field_scale= 3 3 #Odd number
[TransientPropagation]
temperature = 77.36K
charge_per_step = 10
output_plots = true
timestep = 0.02ns
[PulseTransfer]
Output plots
output_plots = 1
output_plots_step = 5.0ns
output_plots_range = 200ns
[CSADigitizer]
model = “csa”
feedback_capacitance = 10e-15C/V
detector_capacitance = 100e-15C/V
krummenacher_current = 25e-9C/s
amp_output_capacitance = 15e-15C/V
transconductance = 50e-6C/s/V
temperature = 77.36K
integration_time = 0.5e-6s
threshold = 10e-3V
sigma_noise = 0.1e-3V
Output plots
output_plots = 1
output_plots_scale = 40ke
output_plots_bins = 400
[DetectorHistogrammer]
name = “detector1”
[DetectorHistogrammer]
name = “detector2”
replace by [VisualizationGeant4] to run the visualization
[Ignore]
mode = “gui”
[ROOTObjectWriter]
Hi @YiweiHuang
how did you attempt to read the file? You need to load the AllpixObjects library to do so, please have a look at the manual here:
One suggestion for your configuration:
I would explicitly state the objects you would like to write in the ROOTObjectWriter configuration, like this:
[ROOTObjectWriter]
include = "PixelPulse", "PixelHit", "MCParticle"
This avoids storing everything.
Best,
Simon
Hi,
I followed this guide to read data from data.root file.
- Open root with the data file attached like root -l /path/to/data.root
- Load the current library of objects with .L path/to/libAllpixObjects.so
- Build the macro with .L path/to/myAnalysisExample.C
- Run the macro with analysisExample(_file0, “detector1”)
But the code returned the error “Could not read tree PixelHit, cannot continue.”. I also attached myAnaylsisExample.C.(in .txt format)
Many thanks.
myAnalysisExample.txt (6.1 KB)
Hi @YiweiHuang ,
I think the problem is that your pulses are negative, and your threshold is positive. This means you’ll never get a PixelHit object, which is only created by the digitiser when things are above threshold. You can easily remedy this by either setting a negative threshold or by using the ignore_polarity keyword.
Kind regards,
Håkan
1 Like
Many thanks for your help. We corrected the set of CSADigitizer as you suggested.
But we are unable to get the output plot of the CSADigitizer as shown in Page 7 of https://indico.cern.ch/event/1043567/contributions/4473480/attachments/2294663/3902834/2021-08-17_ap2_csa.pdf
This is the setting of CSADigitizer.
[CSADigitizer]
model = “csa”
feedback_capacitance = 10e-15C/V
detector_capacitance = 100e-15C/V
krummenacher_current = 25e-9C/s
amp_output_capacitance = 15e-15C/V
transconductance = 50e-6C/s/V
temperature = 77.36K
integration_time = 0.5e-6s
#threshold = 10e-3V
threshold = -10e-3V
#ignore_polarity = true
sigma_noise = 0.1e-3V
Output plots
output_plots = 1
output_plots_scale = 40ke
output_plots_bins = 400
output_pulsegraphs = 1
how can we find the similar plot in the data.root file?
Regards,
Yiwei
Dear @YiweiHuang ,
your configuration looks good in terms of plot generation. The graph you are referring to should be available in the histogram file, which is by default named modules.root (you can change the file name in the first section ([Allpix]) of your configuration file. The data file, by default named data.root, holds simulation data, but no histograms.
Can you verify that the graph is available in the histogram file?
Cheers
Paul
Thanks for figuring out how to find the histogram. It works on the default example configuration. Thanks again.
However, when we want to implement the CSADigitizer on a 25-pixel detector configuration which was borrowed from
GeometryBuilderGeant4 module, passive volumes in GDML: Question/Issue.
It failed again to have the PixelHit tree. We tried both the positive and negative threshold in the setting of [CSADigitizer]. I appreciate your help in advance.
dialeil-simulation.csadigitizer.conf (2.3 KB)
Regards,
Yiwei
Hi @YiweiHuang ,
I had a look at the configurations, and I think the issue is that the actual setup gives a very low rate of particles on the detector. The way I read it, you’re shooting x-rays at a sample, and then catching what comes out orthogonally on the detector (through a window).
This shows 1000 events, and as you can see, not a lot actually hits the detector on the right.
I ran with 100 000 events with the config file from the question you linked (using [DefaultDigitizer] with a threshold of 1), and I only ended up with around 80 events on the detector.
Running your config with 10 000 events and a very low threshold, I get this:
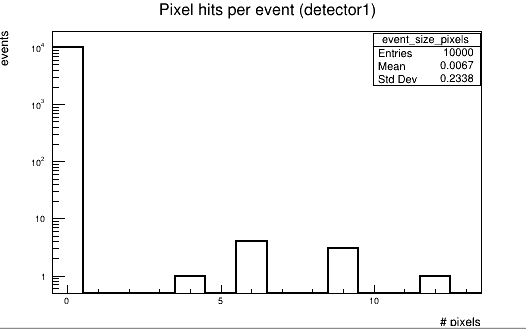
Note the logarithmic scale on the y-axis; very few non-zero events.
We can also look at pulsegraphs for these events in ModFile00000.root under CSADigitizer, which might be helpful! At a quick glance it looks like the set threshold of -10e-3V is a factor of 1000 too big to get any PixelHits with this configuration. Setting the threshold to -10e-6V gives me a PixelHit tree with 47 hits for a run with 10 000 events.
I would also suggest having a think about the electric field, and if you have a better representation of it. The currently used example field really doesn’t do much in the simulated pixel geometry, so maybe a parametrised field or just a parabolic or linear one would do a better job at describing your sensor. The will greatly affect charge collection, and thus the induced pulses.
Kind regards,
Håkan
