Hello,
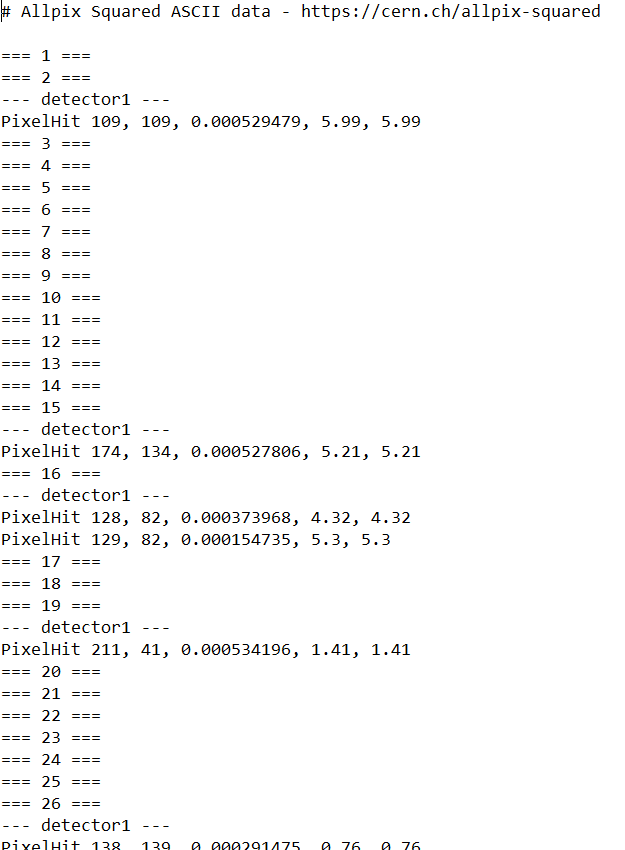
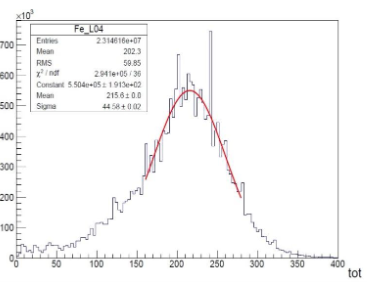
I am simulating a Timepix detector and I would like to calculate the ToT. I would like to create a plot like the one attached in order to fit it with a gaussian and then proceed with the energy calibration of single pixels of the detector (as shown in the next attached plot). However, I am not sure how the information about the Time over Threshold is stored in the Pixelhit file. So far I have managed to acquire the ones that are attached using the TextWriter. Could you tell me what each column is ? One of the Pixelhit files is with DefaultDigitizer and the other one is with CSADigitizer.
Thank you very much in advance! Please let me know if I didn’t make myself clear at any point.
Best wishes,
Pinelopi
Hi @pchristo
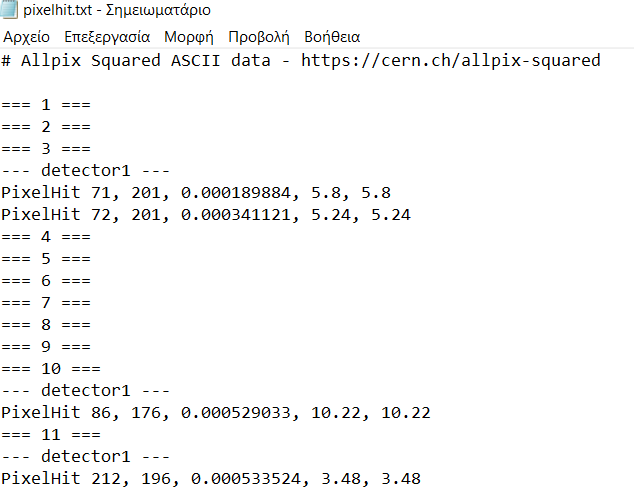
the TextWriter writes out the ASCII representation of the object, so in your case this here. This means, the individual columns are:
PixelHit index_X, index_Y, signal, local_time, global_time
The units of time are nanoseconds. So I guess you are looking for the signal column.
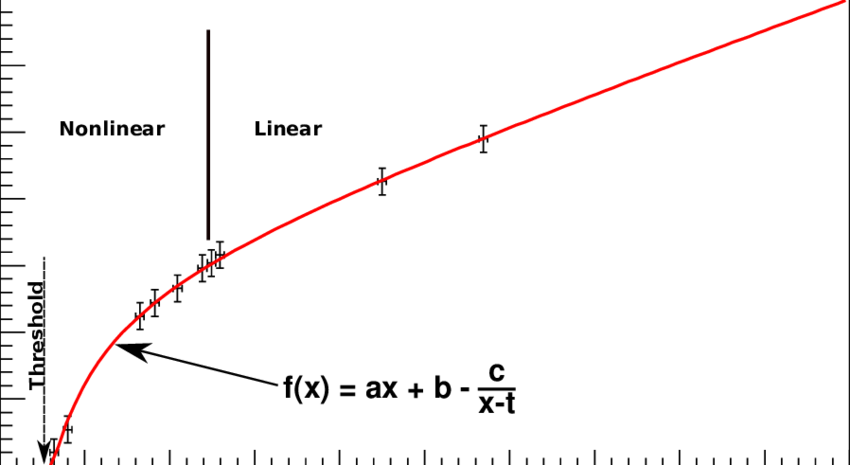
With the DefaultDigitizer we currently only are able to describe the linear part of your ToT function, the non-linear part at very small charges/ToT values is not described. You can control the calibration of the curve with the qdc_* parameters, changing slope, offset etc as described in the module’s README.
For the CSADigitizer to work, you need to make sure to have a simulation chain that includes time information. This can for example be achieved using the PulseTransfer module instead of the SimpleTransfer. Depending on the previous step of your simulation it will either take the current pulses or the arrival time of electrons/holes at the implant to build a current pulse for the input of your amplifier. After this, you need to adjust the front-end parameters as well as the clock speed for sampling your ToT signal.
Let me know if you need more information!
All the best,
Simon
1 Like
Dear Simon,
thank you very much for your reply! Is the signal column from PixelHit also in ns, if for example I use the parameters for the CSADigitizer given in the manual ?
[CSADigitizer]
model = “csa”
feedback_capacitance = 10e-15C/V
detector_capacitance = 100e-15C/V
krummenacher_current = 25e-9C/s
amp_output_capacitance = 15e-15C/V
transconductance = 50e-6C/s/V
temperature = 298
integration_time = 0.5e-6s
threshold = 10e-3V
sigma_noise = 0.1e-3V
Thank you very much!
Best wishes,
Pinelopi
Hi @pchristo
since you did not set clock_bin_tot in your config, the output of the signal is not a time but the integral of your shaped pulse. If you enable ToT simulation, the output will not be in nanoseconds, but a number of clock cycles of the chosen frequency.
/Simon
1 Like
Dear Simon,
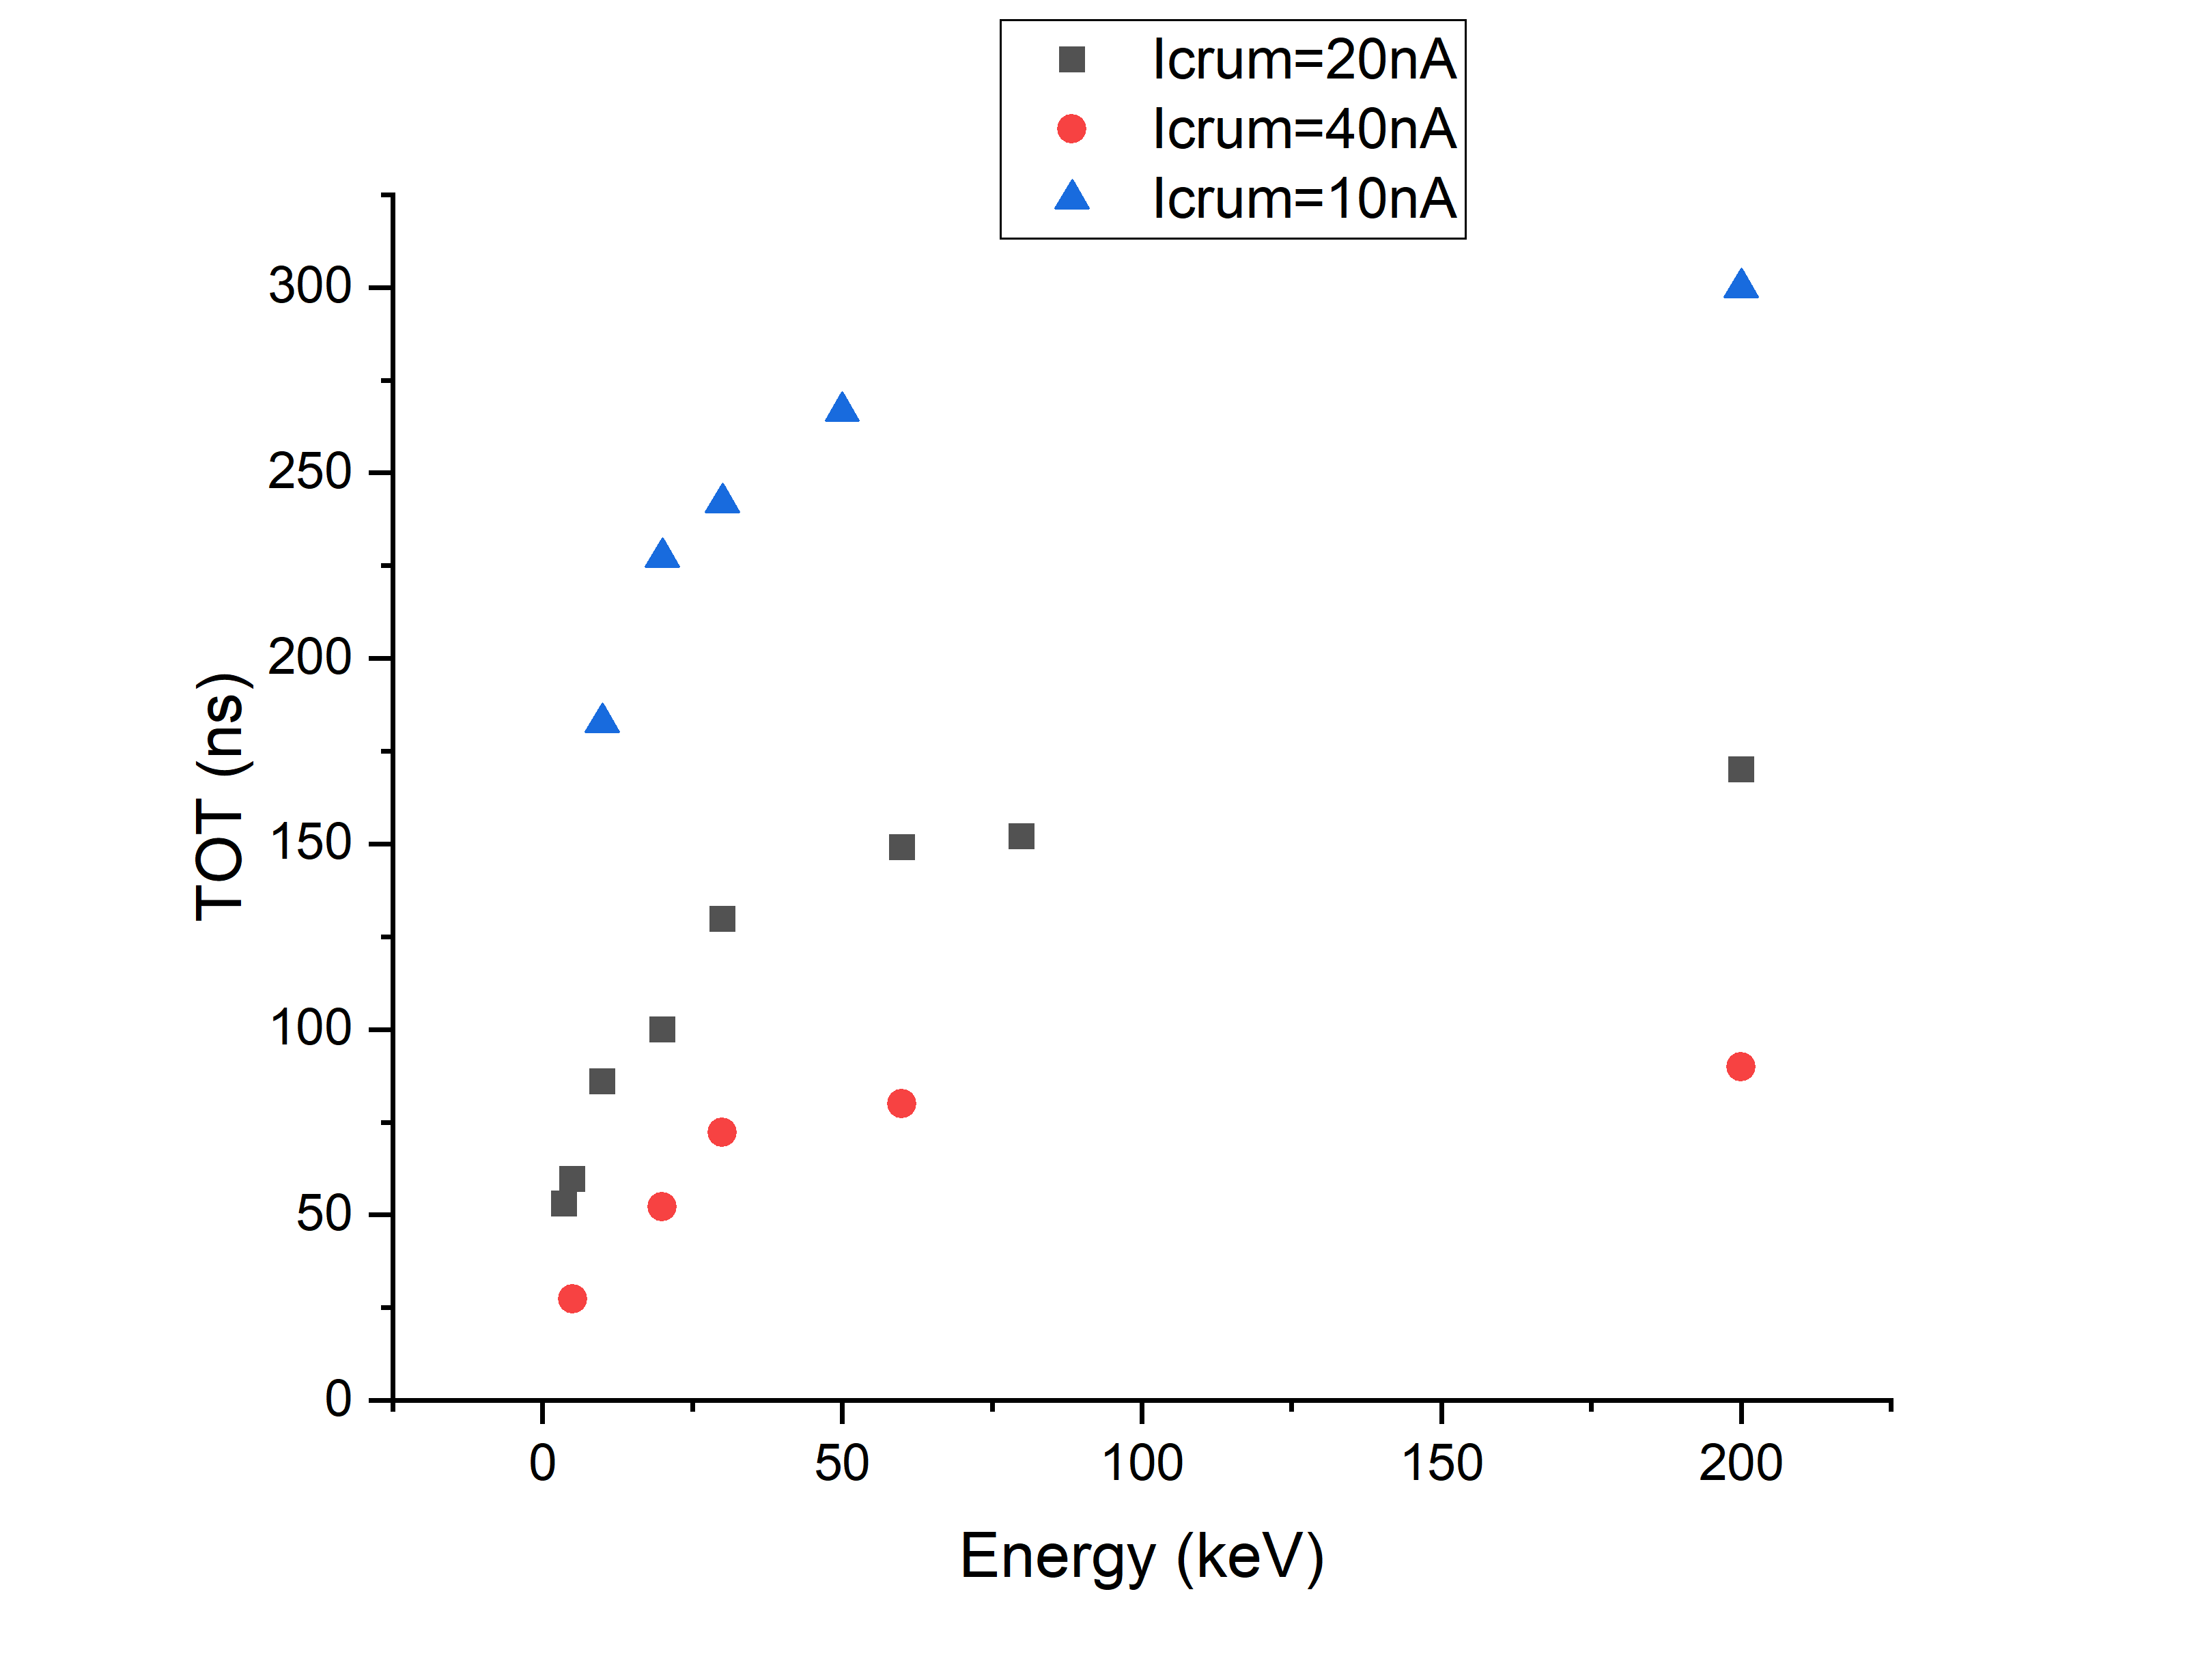
thank you so much for your helpful reply! I followed your advice and indeed now I get the ToT values in number of clock cycles. However I get a saturation of the ToT values after 60keV as you can see in the attached picture. I got the same behavior for both models of the CSADigitizer (csa and simple). I noticed that in src/modules/CSADigitizer/CSADigitizerModule.cpp · master · Allpix Squared / Allpix Squared · GitLab there is also an option for a “CUSTOM” model. Could you elaborate on this ? Is it possible for me to create a custom model with different transfer function so that there is no saturation of the signal (at least not until 700keV) ? Thank you again in advance!
Best wishes,
Pinelopi
Hi @pchristo
just to make sure the issue isn’t anywhere before that - could you post your full configuration here for reference? Either attach the file or place the conmtent in tripple-backticks (like ```)
Best,
Simon
1 Like
Dear Simon,
sure, the attached pdf file is the configuration that I have used. I hope it helps.
Best wishes,
Pinelopi
simulation_allpix_squared_tot.pdf (68.9 KB)
Dear @pchristo ,
about the saturation: there are many parameters for the CSADigitizer you left open, such as the threshold. Reducing this should extend the dynamic range of the above graph - if it’s physical for your setup of course.
Another critical parameter might be the integration_time, but by default this is 500 ns, so it shouldn’t be the issue.
For my own education: for the above plot, did you leave all CSA parameters as default values except for the current?
Cheers
Paul
1 Like
Dear Paul,
thank you very much for your reply. Yes, in the configuration file I chose the default values and then I was changing the Krummenacher current. However, I also tried changing the parameters of the simulation (like the threshold and the integration time that you mentioned) and I got the same saturated behavior. So one possible issue would be the fact that the transfer function is not ideal. I am looking forward to your suggestions. Thank you very much in advance!
Best wishes,
Pinelopi
Hi Pinelopi,
I tried with the following settings:
[CSADigitizer]
clock_bin_tot = 25ns
integration_time = 20us
threshold = 5e-3V

model = "simple"
feedback_capacitance = 10e-15C/V
feedback_time_constant = 400ns
rise_time_constant = 300ns
sigma_noise = 0
and see a behaviour which doesn’t fully saturate, but also never gets fully linear - as far as I’m aware this is expected due to the exponential fall function.
You can see it here (with input charge on the x axis and the ToT on the y axis):
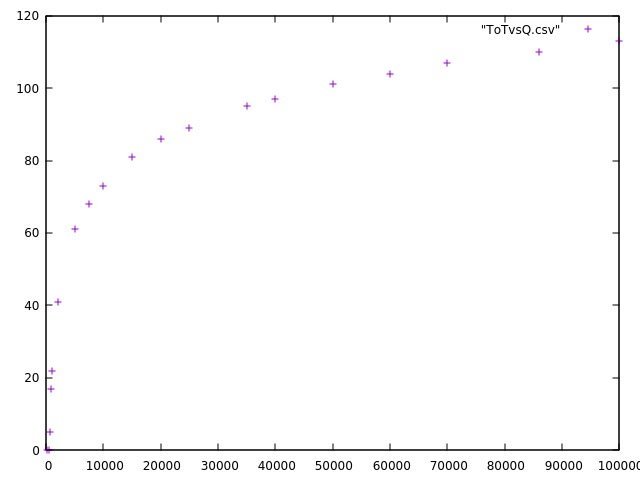
Mind that I also set the noise to zero, which is more academic but also has a bit of an impact.
For a linear rise of the ToT I assume a different response function is indeed required.
Best
Paul
2 Likes
@pschutze Does the signal that is outputted from the getSignal() function directly plot to the graph you produced? Or is there other details that are needed?
Thanks!
Hello @oobie2142 ,
no, it does not. I made this by using the DepositionPointCharge module, and for each run of Allpix Squared I changed the number_of_charges parameter (x axis) and read the ToT from the histogram file. The plot was generated by post processing.
Best
Paul
@pschutze When you say read ToT from the histogram file, was that in the modules.root? Or is that from the getSignal()? Thanks!
In this particular case, I simply read it from the corresponding graph of the modules.root file.
@pschutze I see thank you so much!