Hello, when I observed the simulation results of the hexagon pixel detector, I had doubts about the results of hitmap. What is the layout and shape of the hexagon detector? Is it a parallelogram, and if so, what is the mapping between the resulting rectangle and the parallel quadrilateral?
Hi @fkh ,
Can you post your hitmap here, please? That will help in explaining what you see!
In general, when using geometry = hexagon, the individual pixels will be hexagons. There are two possibilities of their orientation, as shown here: Sensor Geometries | Allpix Squared
Now, one thing that happens when using a hexagonal geometry is that the local coordinate system changes, and I’m guessing this is what is making some odd plots. Instead of a regular Cartesian coordinate system with 90 degrees between the x- and y-axis, we have a system with 60 degrees between the axes, to align with the hexagonal grid.
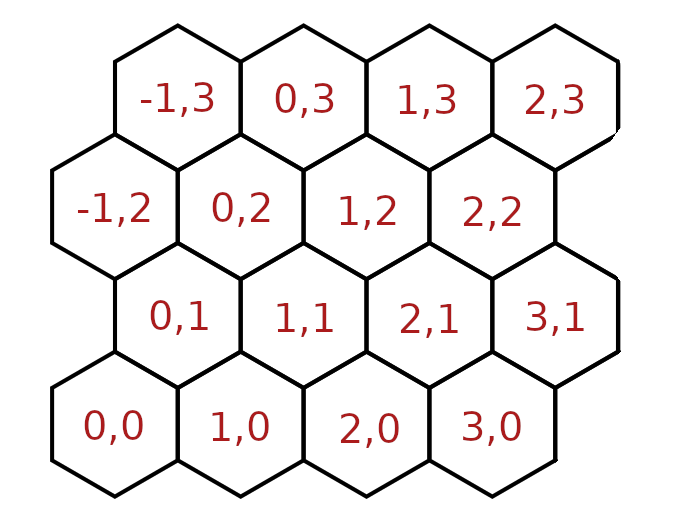
This image from the original merge request can be helpful, in seeing how the pixel indices are defined along the axes:
Hope this helps!
Kind regards,
Håkan
Thank you very much for your reply ![]() . @hwennlof I’m sorry that I didn’t check the email in time.
. @hwennlof I’m sorry that I didn’t check the email in time.
Here is the picture.

I used the telescope example for simulation, but I modified the pixels of mimosa26 to become hexagonal pixels, and the three images are hitmaps of different pixels, they look different. And according to the pictures you reply, hexagonal pixels will have a negative index. However, the index of x or y on the final hitmap is non-negative, so I am very confused about how the hitmap of hexagonal pixels is generated. I guess there may be changes to the index.
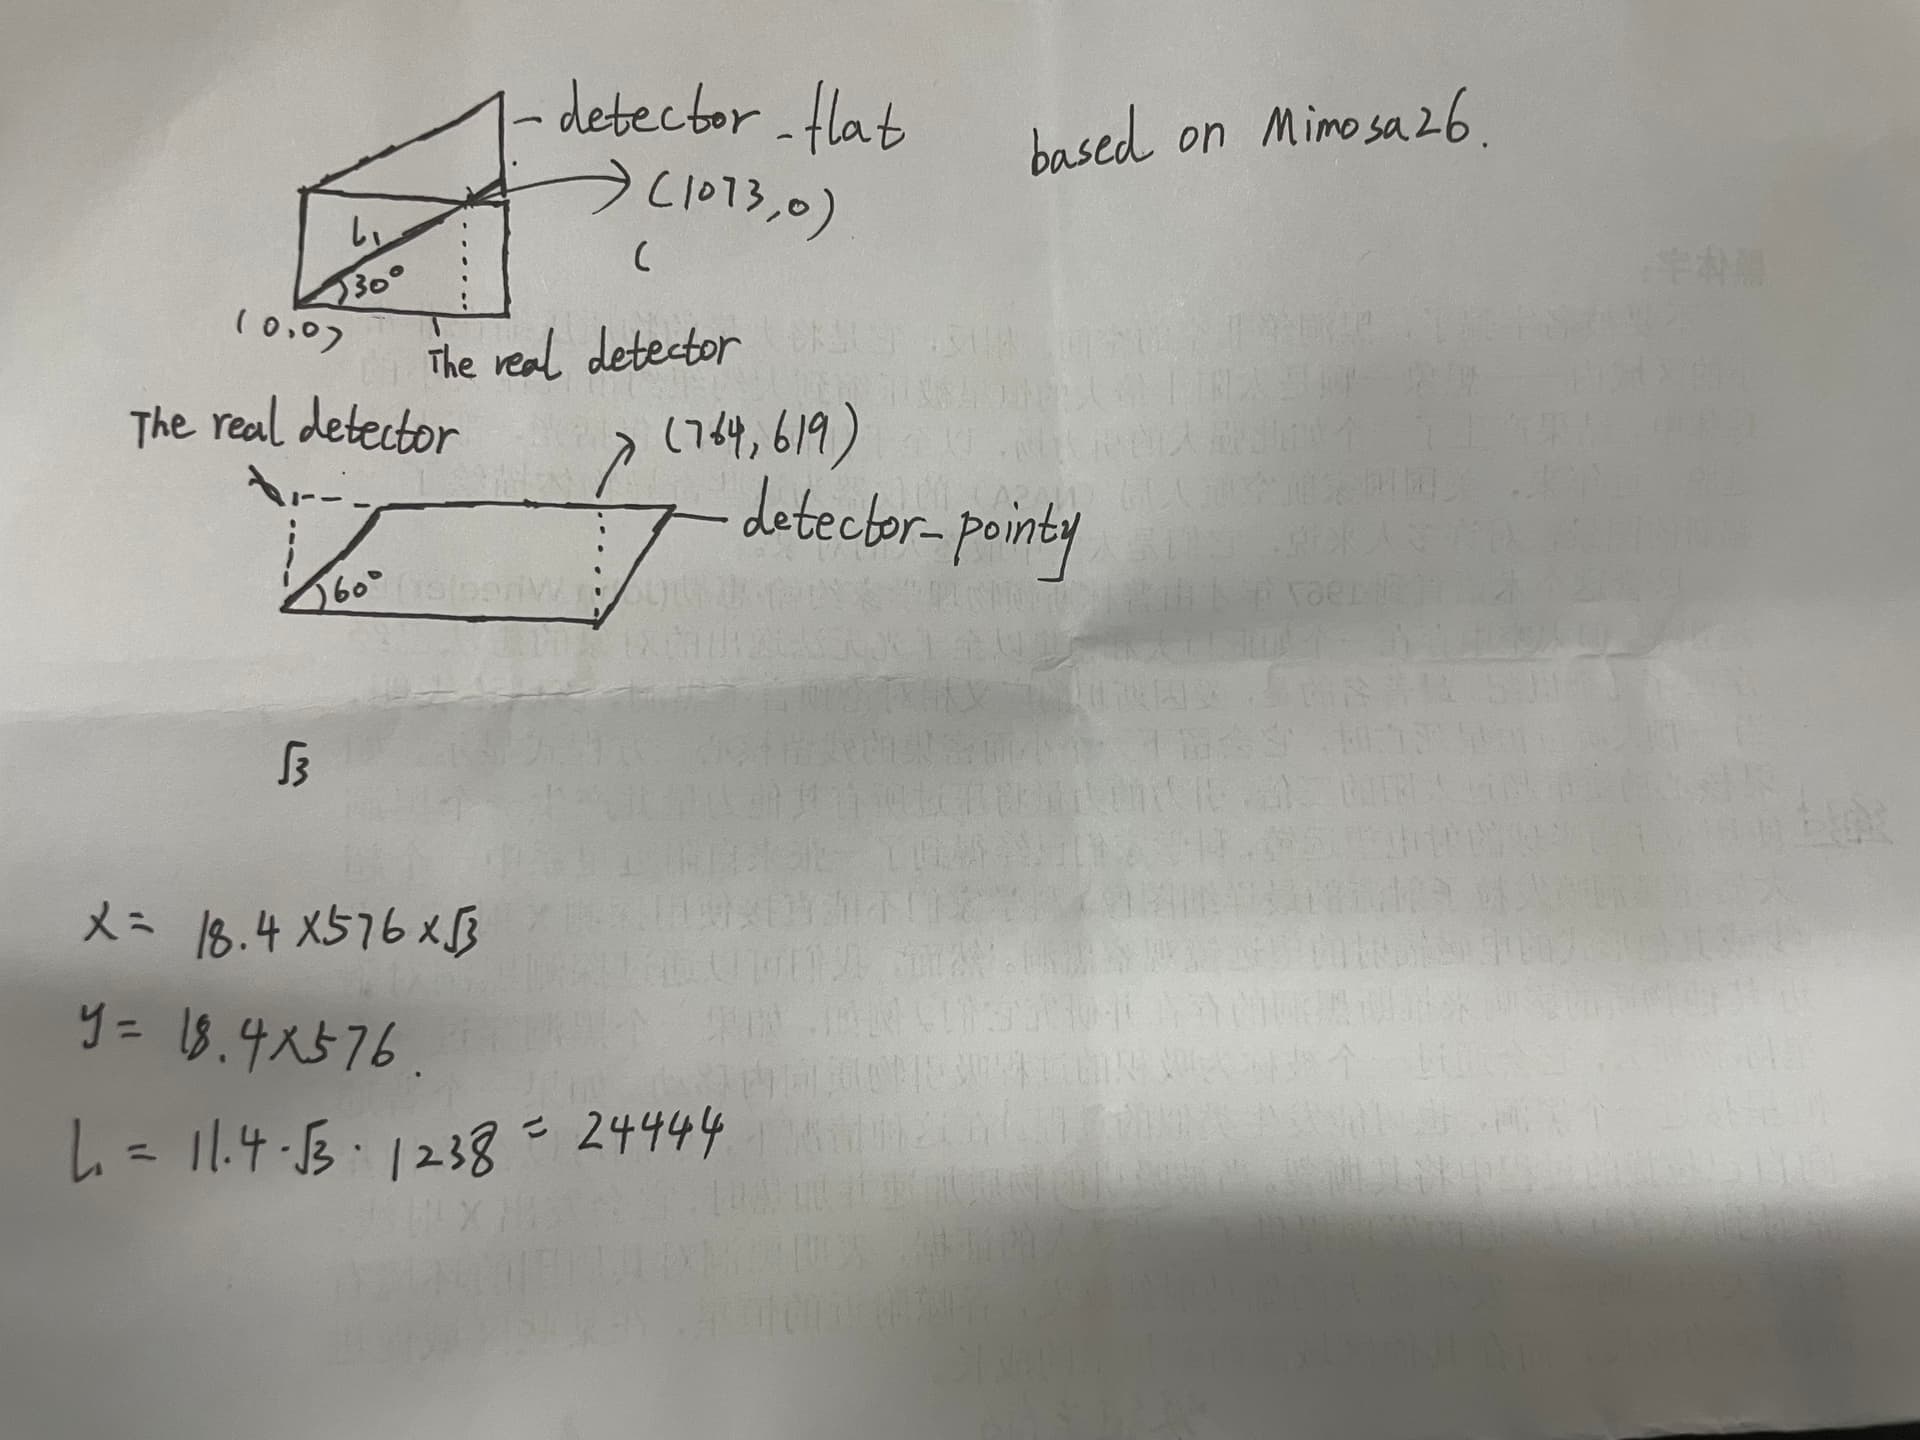
The following picture is my current understanding of the hexagon detector. There should be no index mapping change, but the actual detector was captured and hitmap was drawn according to the index.
The two rectangles are the intercepted detector area, while the two parallelograms are the generated detector, and I indicate the pixel index of their intersection points.
I would appreciate it if you could reply again.
Hi @fkh
the hitmap as generated by the DetectorHistogrammer just (stupidly) plots x and y axis with an angle of 90deg between them (Cartesian). For hexagons, however, the x and y axes are separated only by 60deg, hence the weird shape and cut-off.
We didn’t want to include a lot of if-else code in the DetectorHistogrammer module as it is not intended for analysis of the simulation but only for reference. What you would have to do is to convert the values to a Cartesian coordinate system if you want to plot it in those.
If you look at global coordinates, they should all be fine, have a look e.g. in this presentation:
Best,
Simon
1 Like
Hi @simonspa
Thank you very much for your reply, I will read it carefully.