Hello experts,
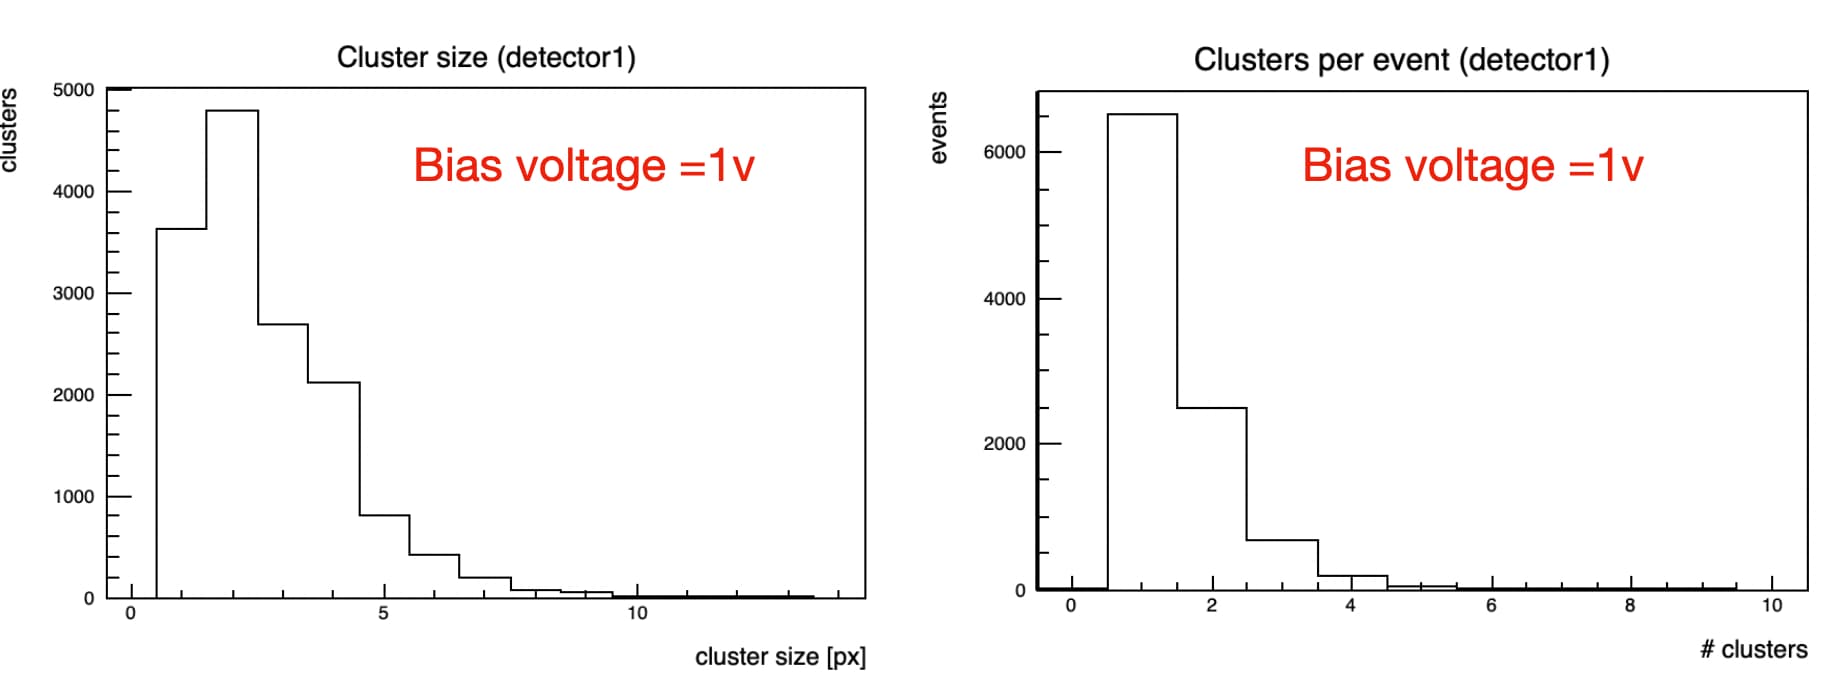
I am trying to simulate (HVTrack detector) which is a silicon detector made of 167*167 matrix, with thickness 150um and pixel size 80um. The detector has been subjected to irradiation with 10k events of carbon ion beams to investigate charge sharing effects. When I tried to look at the resulted root file, I found couple of histograms related to the cluster size. But the results are quite different between the cluster size (clusters vs cluster size) and (events vs clusters). For instance, in the attached image, the occurrence of 2 clusters appears significantly higher in the left plot compared to the right plot for the same simulation. I haven’t understood the difference yet and I find myself somewhat bewildered at this juncture. Could someone kindly assist me in elucidating this matter? As a newcomer to allpix2, any guidance, assistance, or advice would be immensely appreciated. I uploaded the configuration files and the plots and I am using version v3.0.0.
Thank you for your help and support.
Best regards,
Fajer
my2sim.conf (1.3 KB)
mydetector.conf (262 Bytes)