Hi!
New user to Allpix Squared here! I am having some speed-related issues when including multiple objects for output writing to a root file in the RootObjectWriter module. When I include only a single object, the runtime is reasonbly linear with number of events, so every event approximately takes the same amount of time. However, when including an array of objects, I notice the runtime per event is not linear; the later events take much longer than the earlier events. This starts to really be a problem for larger simulations with millions of events.
To verify this behaviour I ran the simulation with four different configurations of the RootObjectWriter module, all other configurations were kept untouched. The simulations consist of 50,000 events each. The following include parameters were passed to the RootObjectWriter module for each of the four simulations:
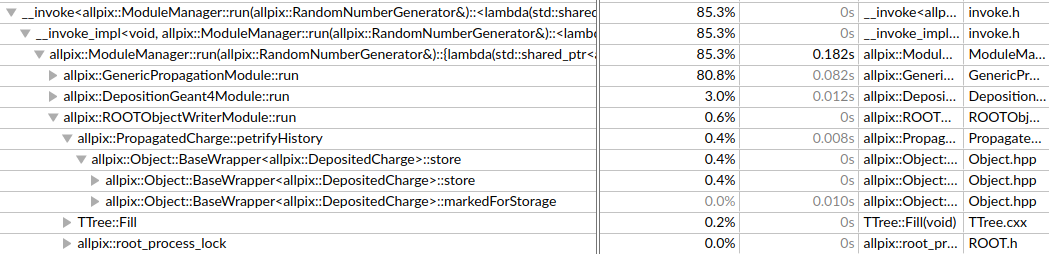
- include = “DepositedCharge”
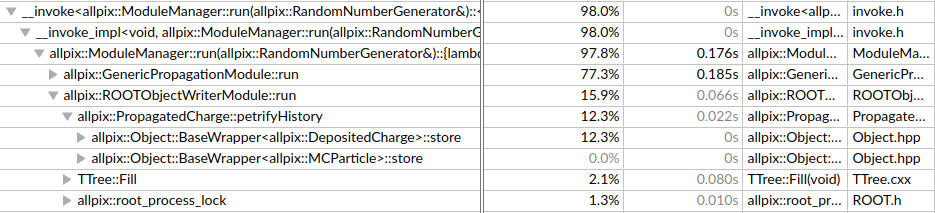
- include = “PropagatedCharge”
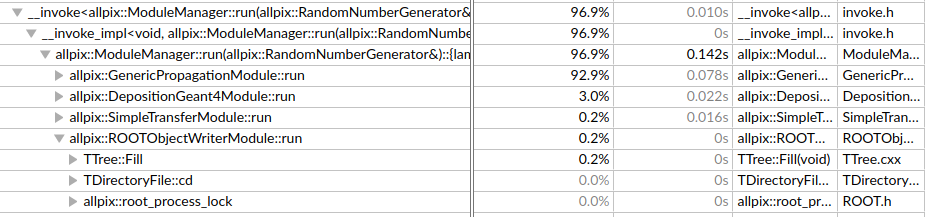
- include = “PixelCharge”
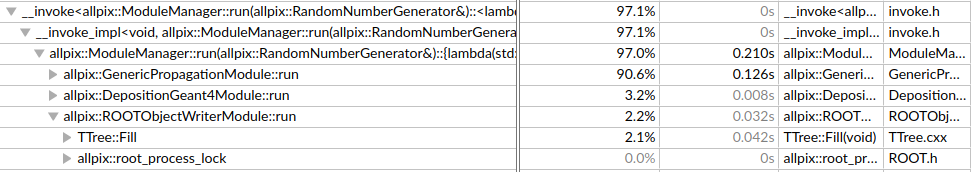
- include = “PixelCharge” “PropagatedCharge” “DepositedCharge”
(as a new user I can only add a single photo to the post, so I wrote out the results for the first three)
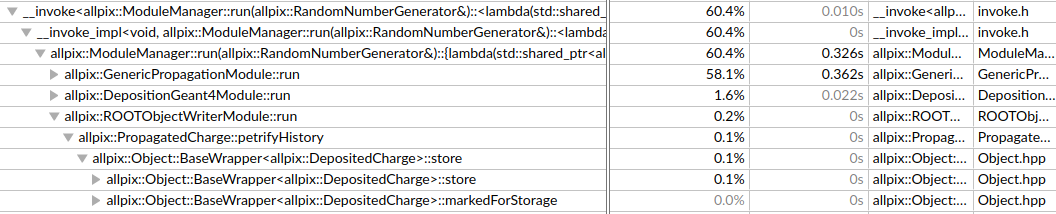
1:
Total time: 4 minutes 25 seconds
Time spent in ROOTObjectWriter: 5.09s
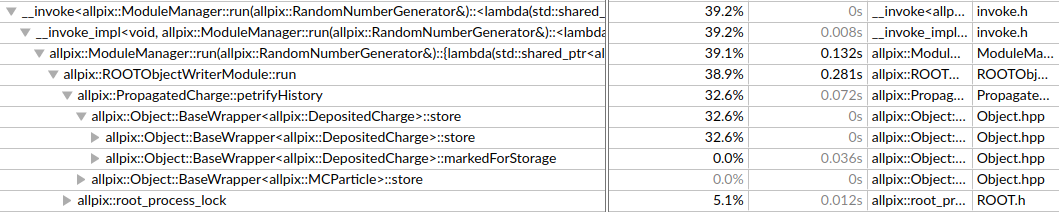
2:
Total time: 4 minutes 23 seconds
Time spent in ROOTObjectWriter: 32.91s
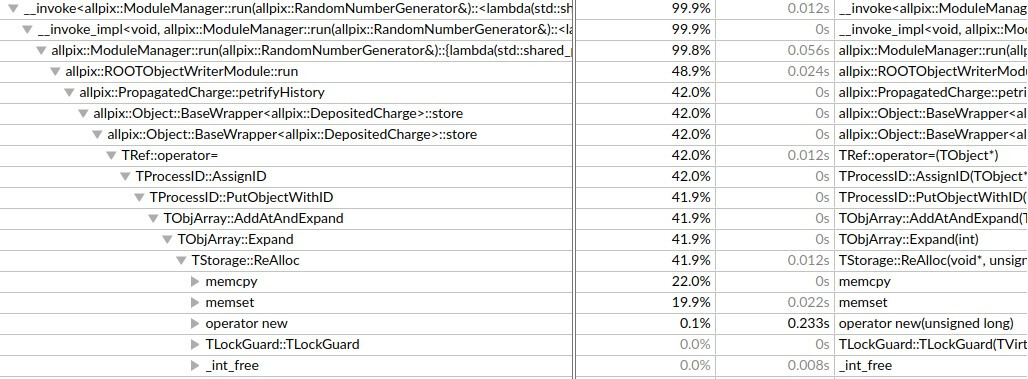
3:
Total time: 4 minutes 17 seconds
Time spent in ROOTObjectWriter: 3.038s
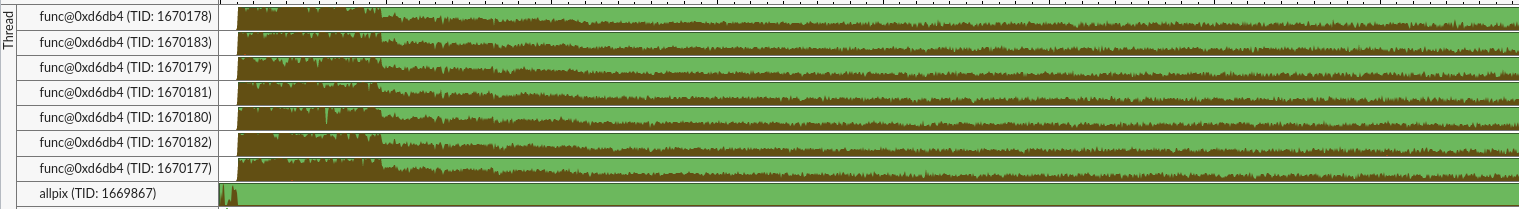
4:
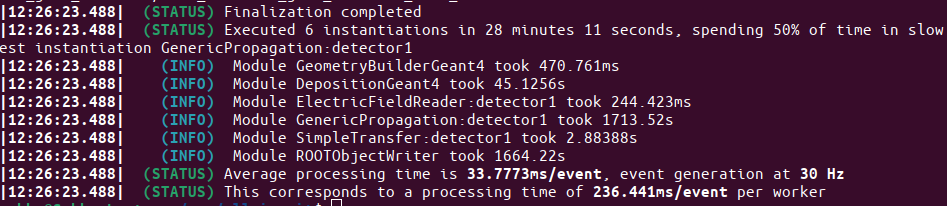
Notice that in the first three cases, only a couple of seconds is spent in the RootObjectWriter module. In the last case, almost half the time is spent this module. This means that it would be faster for me to do the same simulation 3 times, each with a separate object written to a root file, than a single simulation with all three objects. I was wondering if this is a known issue?
Thank you so much!
I wanted to upload my conf files here, but it seems I am not allowed to upload files as a new user, so I have added them here below:
[Allpix]
log_level = "INFO"
log_format = "DEFAULT"
model_paths = "./models"
detectors_file = "./detectors/bare_detector_gold_contacts.conf"
output_directory = "./simulation_results/bare_detector_gold_contacts"
root_file = "bare_detector_gold_contacts_test"
number_of_events = 50000

[GeometryBuilderGeant4]
world_material = "vacuum"
log_level ="WARNING"

[DepositionGeant4]
log_level ="WARNING"
physics_list = FTFP_BERT_LIV
particle_type = "gamma"
source_energy = 4keV
source_type = "beam"
source_position = 0um 0um -10mm
beam_size = 0mm
flat_beam = true
beam_direction = 0 0 1
number_of_particles = 1

[ElectricFieldReader]
log_level ="WARNING"
model = "linear"
bias_voltage=-1000V
depletion_voltage = 500V

[GenericPropagation]
log_level ="WARNING"
temperature = 223K #-50C
integration_time = 200ns
propagate_electrons = true
output_plots = 1
charge_per_step = 10 # Max number of charges propagated together


[SimpleTransfer]
log_level ="WARNING"
max_depth_distance = 5um
output_plots = 1

[ROOTObjectWriter]
log_level ="WARNING"
file_name = "bare_detector_gold_contacts_test_data"
include = "PixelCharge" "PropagatedCharge" "DepositedCharge" # only this line is changed
detector conf:
[detector1]
type = "pin"
position = 0 0 5mm
orientation = 0 0 0

[goldelectrodefront]
type = "box"
size = 10mm 10mm 18nm
position = 0mm 0mm 3.499991mm #3.5mm - 9nm
orientation = 0 0 0
material = "Au"
role = "passive"
color = 1 0.8 0
Model:
type = "monolithic"
geometry = "pixel"

number_of_pixels = 1 1
pixel_size = 10mm 10mm
sensor_material = "SILICON"

sensor_thickness = 3mm
sensor_excess = 0um

chip_thickness = 5um