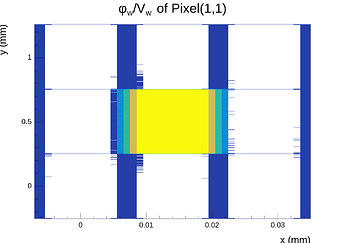
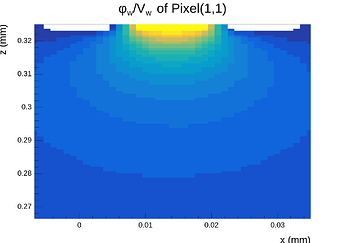
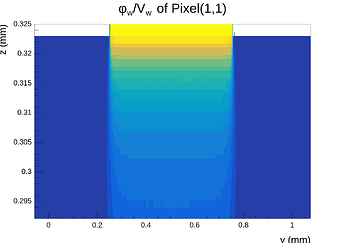
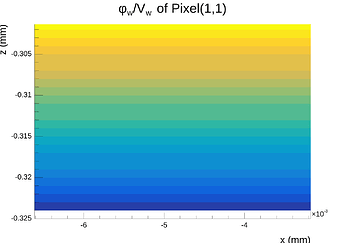
Hi @simonspa,
I’m happy to share it. It is not pretty, as I just threw it together and it seems to work.
A peculiar thing I need to mention is that even when making the mesh symmetric in the X- and Y-directions around the center point of the center pixel, the X-component of the E-field at the surface (electrode side) is not symmetric after exporting it and inspecting in Python, even though the mesh is symmetric and the solution is symmetric and proper when inspected in COMSOL. This quickly disapears as one moves into the sensor away from the electrodes.
This is especially odd given that the evaluation points should be in the mirrored points of the mesh nodes.
I am in contact with COMSOL to see if we can figure out why this happens and will try to remember to update this post if a solution comes along.
I really need to stress that it is not a pretty piece of code, and perhaps not suited to be implemented into the framework, especially given the peculiarity above. It would be prettier, if not better, to implement the use of the COMSOL Multiphysics binary file (.mphbin) as defined in the COMSOL programming reference manual, and directly interpolate from the nodes of the solution. Though I suspect that this would need quite a bit more work, by someone much more well versed in C++ than I.
In the mean time, the code is below (I take no responsibility for the code and it is used at any ones own “risk”).
- Export the field from COMSOL in a grid, evenly spaced, as a
.txt file
- Use the code below to format the field into a .init file that APSQ can read
import numpy as np
from tqdm import tqdm

def loadField(path):
    """
    Takes in the file that you want to convert to a format APSQ can read.

    Input
    --------------------------
    path: string variable of the path to the relevant exported text file you get from COMSOL. Can be either the electric field or the weighting potential

    Returns a tuple
    --------------------------
    XX, YY, ZZ, field_list,  width, depth, thickness


    Input text file formatting
    --------------------------
    The electric field file needs to be formatted as comma separated values, row by row in the format x, y, z, Ex, Ey, Ez.
    The weighting potential file needs to be formatted similarly as x, y, z, V.
    Above the quantities x, y, z is the 3D point where the E-field is evaluated at, and Ex, Ey, Ez is the field vector at that point,
    similarly for the weighting potential, but the weighting potential is a scalar.
    Also, the fields needs to be evaluated at regular intervals, i.e. not in the mesh points of COMSOL.

    """
    # with open(path+'weightingField_1um_15wide_3deep_14umPitch.txt', 'r') as f:
    with open(path, 'r') as f:
        lines = f.readlines()

    N = len(lines)

    n = np.sum([xx[0] == "%" for xx in lines[0:100]]) # In case the header is included

    N -= n

    x = np.zeros(N)
    y = np.zeros(N)
    z = np.zeros(N)


    data = lines[100].strip().split(",") #100 is arbitrary, only to get "dim"

    # Depending on your formatting in the E field, you might want to also have the potential as the seventh value.
    if (len(data) == 7) or (len(data) == 6):
        dim = 3
    elif len(data) == 4:
        dim = 1
    else:
        raise Exception("Unknown data formatting")

    if dim == 3:
        field3D = np.zeros((N,3))
    else:
        field1D = np.zeros(N)

    idx = 0
    lines = tqdm(lines)
    lines.set_description("{: <15}".format("Loading data"))
    for line in lines:

        if line[0] == "%":
            continue
        else:
            data = line.strip().split(",")

            x[idx] = round(float(data[0]),3)
            y[idx] = round(float(data[1]),3)
            z[idx] = round(float(data[2]),3)
            if dim == 3:
                field3D[idx] = float(data[3]), float(data[4]), float(data[5])
            else:
                field1D[idx] = float(data[3])
            idx += 1

    width = round(x.max()-x.min())
    depth = round(y.max()-y.min())
    thickness = round(z.max()-z.min())

    diffX = round(np.mean(np.diff(np.unique(x))),4)
    diffY = round(np.mean(np.diff(np.unique(y))),4)
    diffZ = round(np.mean(np.diff(np.unique(z))),4)

    #Convert the positions to integers starting from 1, Allpix use them as indices in its arrays

    x = (x - x.min())/diffX + 1
    y = (y - y.min())/diffY + 1
    z = (z - z.min())/diffZ + 1

    Nx = np.unique(x).size
    Ny = np.unique(y).size
    Nz = np.unique(z).size

    if dim == 1:
        field1D[field1D<1e-12] = 0
        field1D[field1D > 1-1e-12] = 1

    if dim == 3:
        eFieldX = np.zeros((Ny,Nx,Nz))
        eFieldY = np.zeros((Ny,Nx,Nz))
        eFieldZ = np.zeros((Ny,Nx,Nz))
    else:
        weightingField = np.zeros((Ny,Nx,Nz))

    XX = np.array([int(k) for k in x])
    YY = np.array([int(k) for k in y])
    ZZ = np.array([int(k) for k in z])

    posRange = tqdm(range(x.size))
    posRange.set_description("{: <15}".format("Filling arrays"))
    for idx in posRange:

        xCor, yCor, zCor = XX[idx]-1, YY[idx]-1, ZZ[idx]-1
        if dim == 3:
            eFieldX[yCor, xCor, zCor] = field3D[idx,0]
            eFieldY[yCor, xCor, zCor] = field3D[idx,1]
            eFieldZ[yCor, xCor, zCor] = field3D[idx,2]
        else:
            weightingField[yCor, xCor, zCor] = field1D[idx]

    if dim == 3:
        return (XX, YY, ZZ, [eFieldX, eFieldY, eFieldZ],  width, depth, thickness)
    else:
        return (XX, YY, ZZ, [weightingField],  width, depth, thickness)


def write_field(file_name, data_tuple):
    """
    This formats the field from COMSOL according to this page: https://allpix-squared.docs.cern.ch/docs/14_additional/mesh_converter/
    """
    (XX, YY, ZZ, field_list, width, depth, thickness) = data_tuple
    dim = len(field_list)

    if dim == 3:
        eFieldX, eFieldY, eFieldZ = field_list[0], field_list[1], field_list[2]
    elif dim == 1:
        weightingField = field_list[0]

    # Need these as indices for the arrays
    Xs = np.unique(XX)
    Ys = np.unique(YY)
    Zs = np.unique(ZZ)

    Nx = Xs.shape[0]
    Ny = Ys.shape[0]
    Nz = Zs.shape[0]

    #Check for nans
    if dim == 3:
        nans = np.sum(np.isnan(eFieldX))
        nans += np.sum(np.isnan(eFieldY))
        nans += np.sum(np.isnan(eFieldZ))
    else:
        nans = np.sum(np.isnan(weightingField))

    assert nans == 0


    with open(file_name, 'wb') as f:
        X = tqdm(Xs)
        X.set_description("{: <15}".format("Formatting data"))
        line = "Solved_at_250V_293K \n\
    ##SEED##  ##EVENTS## \n\
    ##TURN## ##TILT## 1.0 \n\
    0.00 0.0 0.00 \n\
    {} {} {} 293 0 0 0 {} {} {} 0\n".format(thickness, width, depth, Nx, Ny, Nz).encode('ascii')
        f.write(line)
        for xx in X:
            for yy in Ys:
                for zz in Zs:
                    if dim == 3:
                        line = "{} {} {} {} {} {}\n".format(int(xx),
                                                            int(yy),
                                                            int(zz),
                                                            eFieldX[yy-1,xx-1,zz-1]/100,
                                                            eFieldY[yy-1,xx-1,zz-1]/100,
                                                            eFieldZ[yy-1,xx-1,zz-1]/100).encode('ascii')
                    else:
                        line = "{} {} {} {}\n".format(int(xx), int(yy), int(zz), weightingField[yy-1,xx-1,zz-1]).encode('ascii')
                    f.write(line)


if __name__ == "__main__":

    file = 'E_field_path.txt'

    # These are just to check if it is a weighting potential or an e-field, change to anything else
    if "E_field" in file:
        data_tuple = loadField(file)
        eFieldX, eFieldY, eFieldZ = data_tuple[3][0], data_tuple[3][1], data_tuple[3][2]
    elif "W_potential" in file:
        data_tuple = loadField(file)
        weightingField = data_tuple[3][0]
    else:
        raise Exception()

    dim = len(data_tuple[3])

    width, depth, thickness = data_tuple[-3:]

    print("\n\nDOUBLE CHECK")
    print("Width: {}\nDepth: {}\nThickness: {}".format(width, depth, thickness))


    if dim == 3:
        fileName = "E_field.init"
    else:
        fileName = "W_potential.init"
    write_field(fileName, data_tuple)


