Hello,
I am trying to simulate the response of a CMOS Monolithic sensor (ALPIDE like) to MIPs.
In particular I am interested in the cluster multiplicity and the spatial resolution, and to compare these two quantities to our experimental beam-test data.
When comparing the cluster multiplicities, I get a moderate agreement between data and simulation (clusters are larger in simulation (more diffusion) than in data), which can be even more optimized if I fine-tune the free integration_time parameter (reduce it from 200ns to 75ns).
The issue I am having is in the spatial resolution. In beam-test data we obtained spatial resolution values between 5 and 6 um for thresholds around 150e, while in allpix-simulation I obtained two different kind of distributions, and two different range of values.
I tried calculating the spatial resolution in two ways:
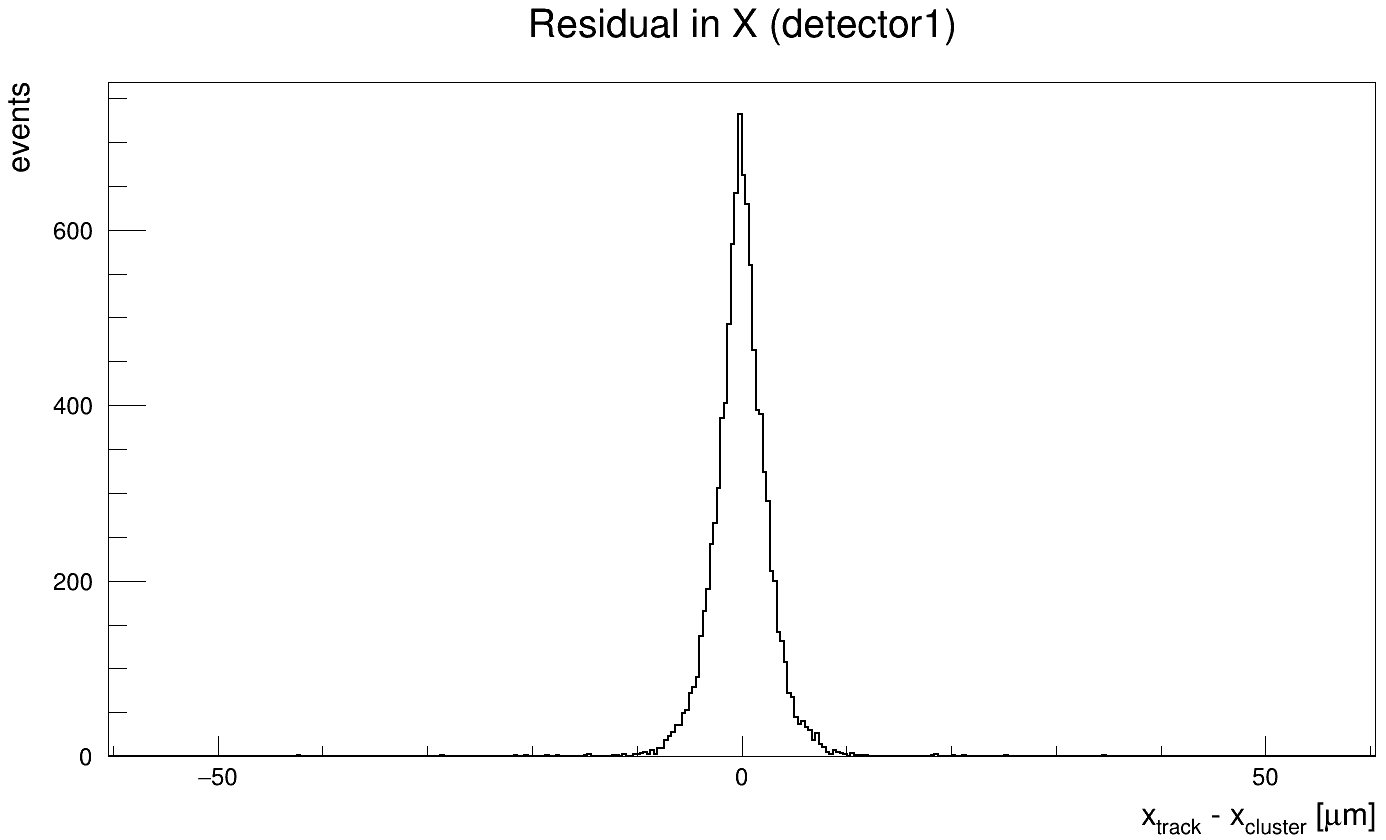
First, by looking into the DetectorHistogrammer output and then perform a gaussian fit to the residual distribution, and then got the resolution by GetParameter(2) function to the fit function. This gives a very narrow gaussian distribution and values even below 3um, which is not realistic at all, and doesn’t agree with the beam-test data. Here is what I got with this way:
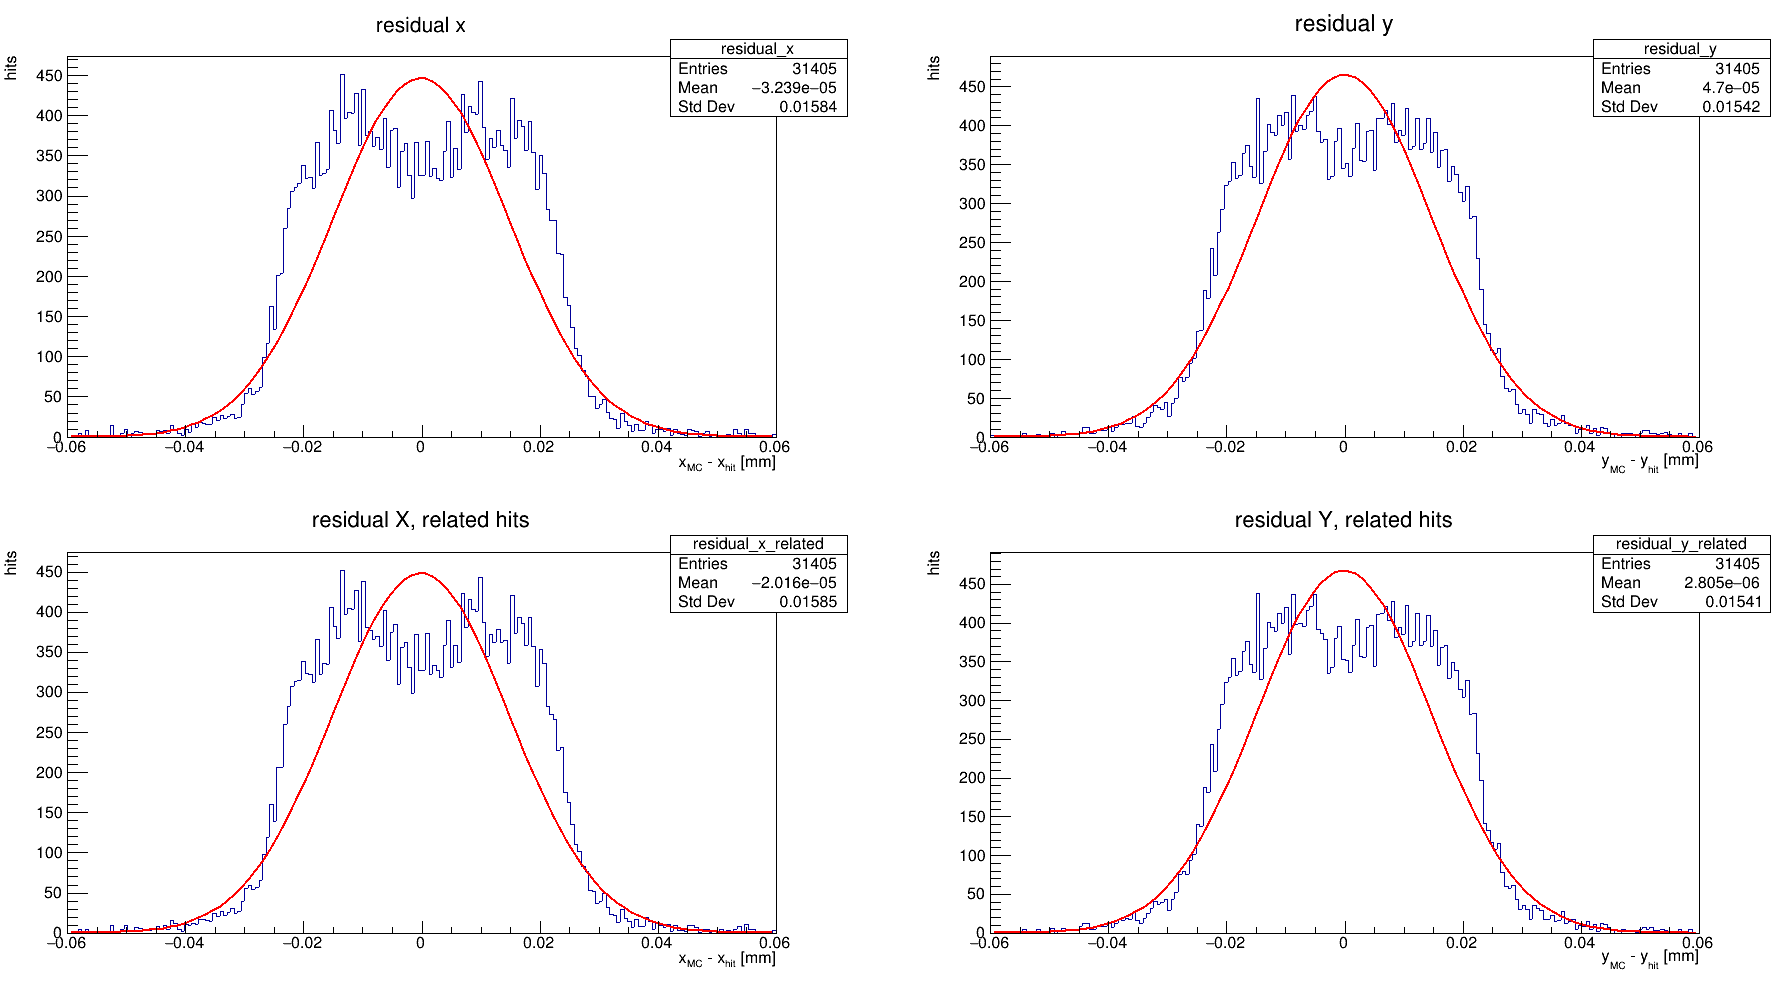
Second, I tried the analysisExample.C macro in the root_analysis_macros directory but it produced different shape results, and the gaussian fit produced residual values of 14 um, which is also not realistic. Here is what I got with this way:
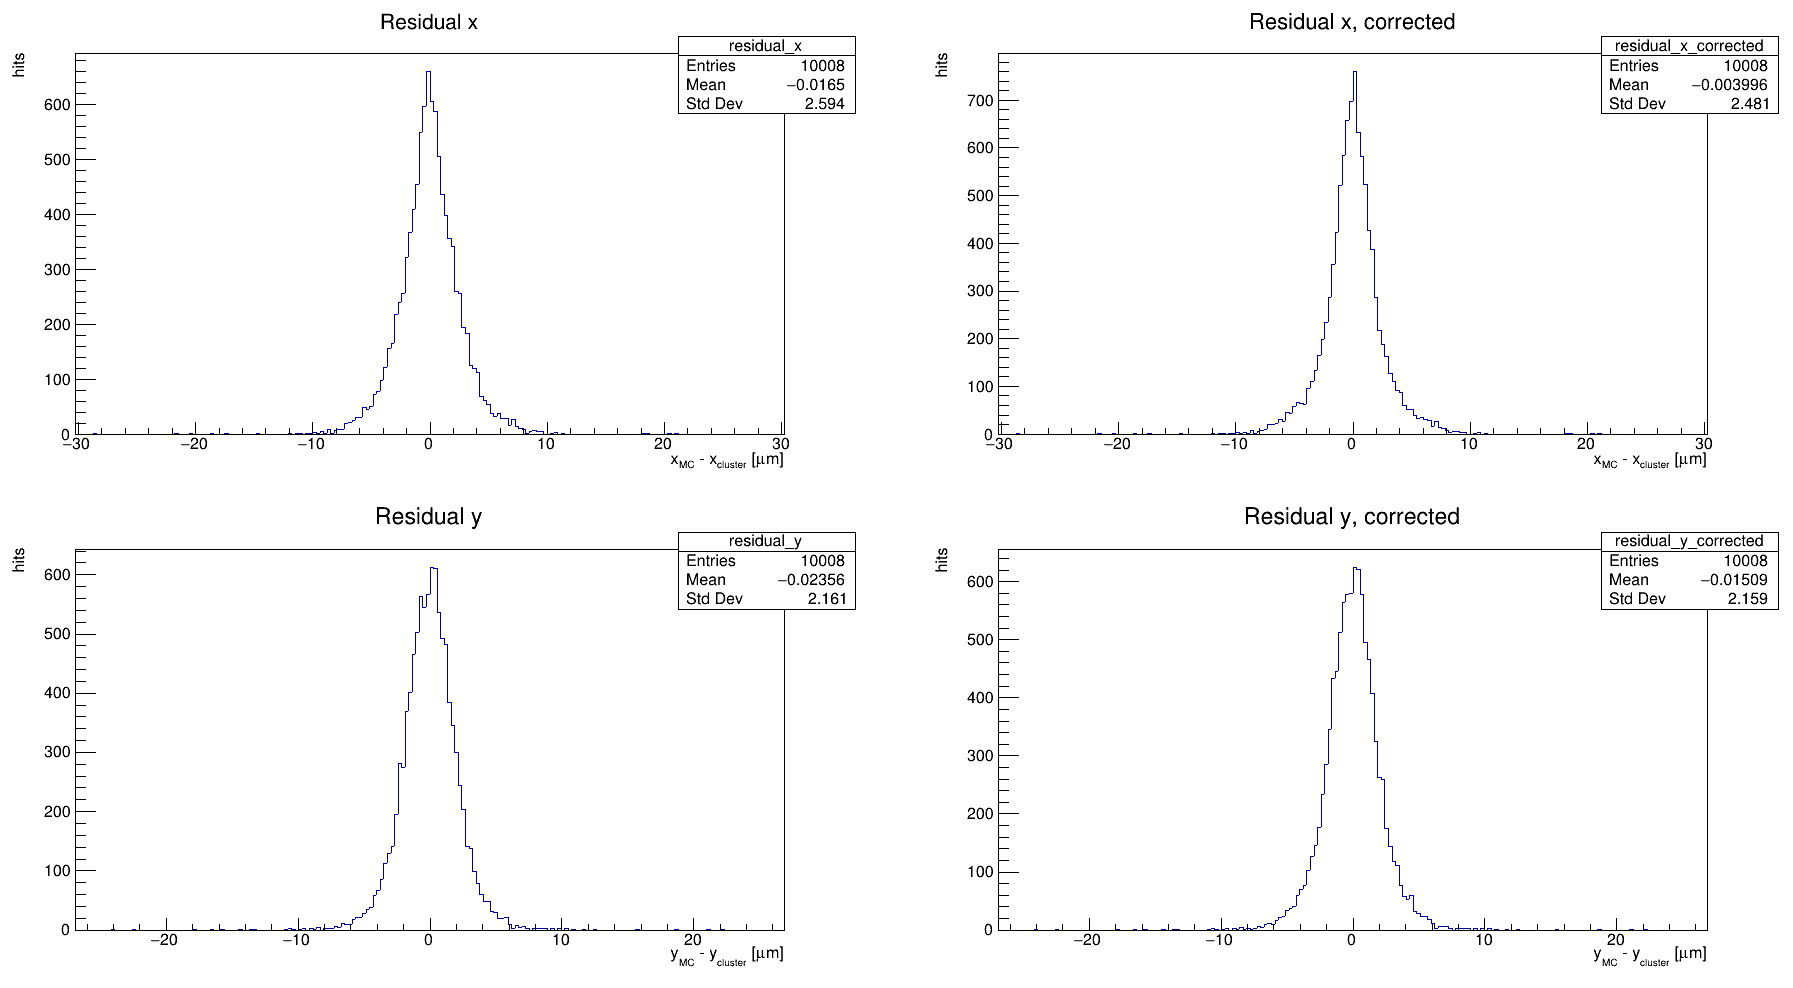
I tried also to perform an eta correction using the etaCorrection.C macro in examples directory. It gives the result I got with the DetectorHistogrammer. Here is what I get with eta correction:
So something is wrong, please if you can help me, to know first which way is better, why I have two differnet distributions and to understand what is going on.
I am also having some doubts:
- Is it because I am having a one detector setup and not a complete telescope eg. of 6 sensors? Does this influence the results?
- Do I have for example to introduce some “misalignments” to the setup so that the very low resolution gets bigger?
- Is the beam_size parameter relevant here? I put it to 2mm.
My main config file:
main_file.conf (4.9 KB)
My geometry file:
geometry.conf (73 Bytes)
My detector model file:
mimosis1.conf (451 Bytes)
The root file I get from [ROOTObjectWriter]:
threshold_scan_output_split1_DC_200ns_1VBB_300K_150.root (2.8 MB)
The root file I get from [Allpix]:
threshold_scan_modules_split1_DC_200ns_1VBB_300K_150.root (2.1 MB)
Thank you in advance!
Hasan
Hi @hdarwish ,
Before I go into some more detail, I’ll give a brief summary; I think there is a twofold main reason for the discrepancy:
- In the simulations, the full charge information is used for cluster position reconstruction, whereas the sensor response is most likely digitised with some resolution. (ALPIDE is just hit/no hit for example)
- Just as you mention, you don’t simulate a non-zero track resolution here.
Now, in some more detail.
Cluster position is reconstructed by weighting the pixel centre positions by the collected charge in each pixel, giving a “centre-of-gravity” position. In your simulation setup, the full collected charge is used, down to single-electron level. In a real sensor, there is some QDC resolution that makes this weighting coarser. If you had a QDC resolution of 1, it would just be hit/no hit, which would mean that for a two-pixel cluster the reconstructed cluster position would be exactly between the two pixels.
As for the differences you see:
Using [DetectorHistogrammer], the track resolution defaults to 0 µm, which is not realistic for comparing to a test beam setup. You can add a (Gaussian) smearing to the track position used in this module via the track_resolution keyword, which should be set to your track resolution at the DUT position.
The way the residual is calculated in [DetectorHistogrammer] is by comparing the reconstructed cluster position to the hit position of all primary particles involved in generating the signal in the cluster.
In analysisExample.C, things are done in a much simpler way. Crucially, there is no clustering done here. Instead, each pixel hit in an event is compared to the mean position of all MCParticles that give rise to the pixel hit. So, it’s a much rougher way of measuring the resolution, and getting no benefit from clustering.
I’m happy to hear you tried out the eta correction example as well! It’s a good idea, especially for residuals that look like those you get from analysisExample.C. This does a similar thing as [DetectorHistogrammer], performing clustering with the charge information and all, and then calculates and applies the eta correction. I would expect these residuals to look the same as from [Detectorhistogrammer] before correction, and to be a bit narrower after correction, but the result will depend on how your eta function looks, which varies a lot between different sensors.
So, to address your doubts:
- Not simulating a track resolution affects your results, no need to simulate a full setup (in most cases), as you can parametrise this by just smearing your track position a bit. If you want to, you can of course simulate a telescope and do a full Corryvreckan reconstruction, but I don’t think that’s necessary in this case.
- Yes, exactly! Add a track resolution. This and the perfect charge resolution are the main things that give a too narrow residual, I think,
- No, the beam size you use looks okay, looking at your hit map the beamspot seems to be nicely within the sensor.
Hope this helps!
Kind regards,
Håkan
Dear @hwennlof ,
I am very thankful for your reply!
However there are still some open points that I didn’t understand:
The beam test data that I am comparing to already subtract the track resolution at the DUT, so it is ‘resolution’ and not ‘residual’.
This means that even if I add track resolution factor to the simulation, I still have to remove it to properly compare to the experimental data.
I understood the difference between the [DetectorHistogrammer] way and the analysisExample.C way.
But I didn’t know which one I should use, the former gives a very small resolution and the latter gives very big resolution, so both of them don’t really match with the beam-test data.
Thank you again and best regards,
Hasan
Hi @hdarwish ,
Okay, I see! Then, if you know your track resolution well, I assume that the main difference comes from the charge weighting used in the clustering. Have a look into the charge distributions, and how digitisation works in your data. The question is how fine-grained the charge information you have is, which will directly impact the cluster position reconstruction granularity. In this vein, also make sure that the noise level you use in the digitisation simulation is realistic. If you simulate perfect charge resolution and low noise, the position reconstruction will be quite precise, leading to a narrow residual distribution. You can play around with different qdc_resolution values to see what happens to the residual.
As to which method to use, it depends on what you do with your data. If you do clustering and no eta correction on the data, I would use the [DetectorHistogrammer] way. Otherwise you disregard any benefit you get from clustering pixels together.
One caveat to all of this is of course your electric fields and doping concentrations, and how accurate those are. If those are accurate and from the foundry, then it’s probably an Allpix Squared thing like we have discussed, but if not, this can have a significant impact on where charge goes and how much is collected. This will impact the reconstructed cluster position significantly.
Kind regards,
Håkan