Interpretation of a plot in LGAD simulation (G4 related)

Dear allpix users,

I’m running a simulation of a LGAD sensor (1.3mm x 1.3 mm, 50 um thickness) and I wanted to test the impact of depositionG4 module parameters on the final results of the simulation.
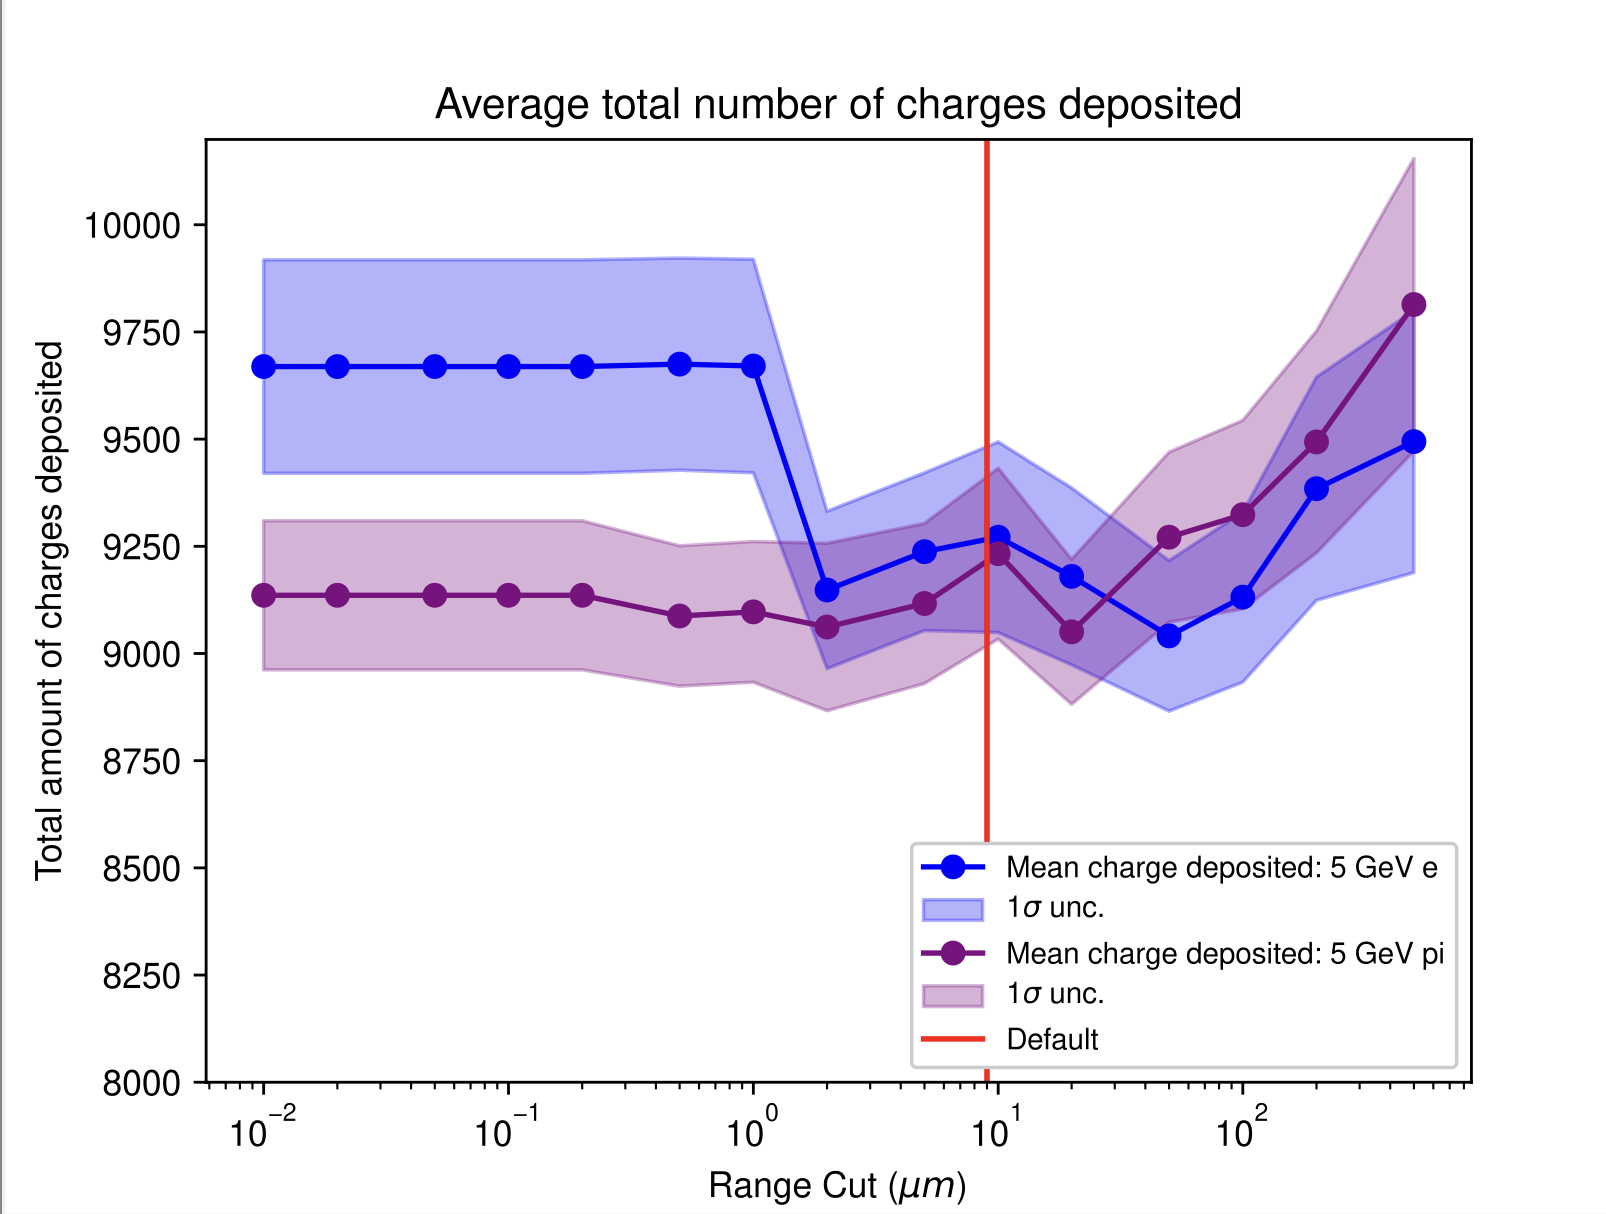
I am then running with the config below, just changing the range_cut parameter, then I’m taking the average total deposited energy in the sensor for different values of range_cut (1000 events, fixed seed). I’m observing a behaviour that I don’t understand and I was wondering if some allpix/G4 expert could explain it to me.

In particular, I’m puzzled about the fact that the deposited energy behaviour is different between electrons and pions. Why does it drop for electrons at some point (to the level of pions), and why there is an increase for very high values of the parameter for both?

I’ll post below the example of the config I’m using and the plot with the results of this study.

Thank you!

[Allpix]
detectors_file = “example_detector.conf”
number_of_events = 1000
random_seed= 2301513560683328971

[GeometryBuilderGeant4]
world_material = “air”

[DepositionGeant4]
physics_list = “FTFP_BERT_LIV”
particle_type = “e-”
number_of_particles = 1
source_energy = 5GeV
source_position = 0.mm 0um -200mm
source_type = “beam”
beam_size = 0.1mm
beam_direction = 0 0 1
max_step_length = 10um
output_plots= 1
cutoff_time= 221s
range_cut= #this param is changed

[ElectricFieldReader]

Hi @andrea_visibile ,

I am not a G4 expert, really, but when I look around I find the following explanation in a forum:

Range Cuts (also called Production Cuts) do not affect active tracks. They affect whether or not the EM processes create new secondaries, or whether they take the energy of those secondaries and add it into the “TotalEnergyDeposit” for a step.

Hence, the step down for electrons could be explained as follows (please note that I didn’t verify this, but is rather a hypothesis of mine): at low range cuts some secondaries are not propagated but simply added to the total energy deposited. At larger cuts, the secondaries start to be tracked and might either leave the silicon bulk or, which is more probable, leave a lower energy. At around 7 keV the range of electrons in Si is about 1 um, this is where you see the drop. This is about twice the energy required for an e/h pair, hence there’s a good probability that the number of e/h pairs drops.

The difference between electrons and pions can arise due to the secondaries that can be produced by either one of them.

Could this explain some aspects of your plot?

Cheers
Paul

… which is of course nonsense… 7 keV corresponds rather to almost 2000 e-h pairs, hence the explanation does not really hold :frowning: thanks @simonspa for spotting…