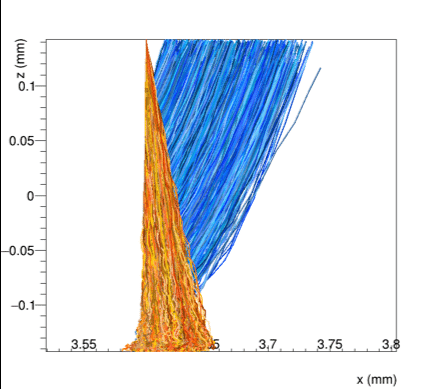
I am trying to plot the trace of carriers propagation throughout the sensor volume, I have used the “generic propagation” module and the plot option: output_linegraphs, output_animations. I had the GIF animation and contour plots of the charge drifting towards the electrodes. I would like to have this plot in colors for different carriers, so I have used the option: output_animations_color_markers. But still, I got the plot with black points. DO you have any idea how to change the color of the path and draw lines (not only moving points) like the attached plot?
I fear that the fact that output_animations_color_markers does not work might be a big, I will have a look at it.
Concerning drawing lines instead - I very much like the idea of that. We currently only draw “snapshots” and stack them on top of each other, but in principle nothing should stop us from doing that with full lines because the information is there.
If you would like to consider working on this and contributing I’d be more than happy to guide you to the right places and help you in preparing the merge request.