Hello everyone I am looking to simulate a Co57 source and record the ToT and ToA values of the simulation simulating a Timepix3 chip. I am using the CSADigitization module with the csa model. I have split the simulation into particle generation and charge digitization into separate files for ease of use and testing purposes.
The Co57source.mac contains three energies (350, 150, 50 keV) each with the same intensity and I have checked the initial energy from the MCTrack object to make sure they are emitted.
My question is why am I not seeing multiple peaks in the ToT plot? Are the energies not far enough apart? Or are the digitizer settings not tuned enough to see the different in energy levels?
Thanks!
ToT_RawPixel.pdf (84.5 KB)
ToT.pdf (82.7 KB)
ToA.pdf (83.8 KB)
Amp_Response.pdf (98.2 KB)
Co57source.mac (1.2 KB)
minipix_tpx3_flex.conf (608 Bytes)
generate_particles.conf (1.3 KB)
digitize_particles.conf (804 Bytes)
detector.conf (217 Bytes)
Hi @oobie2142 ,
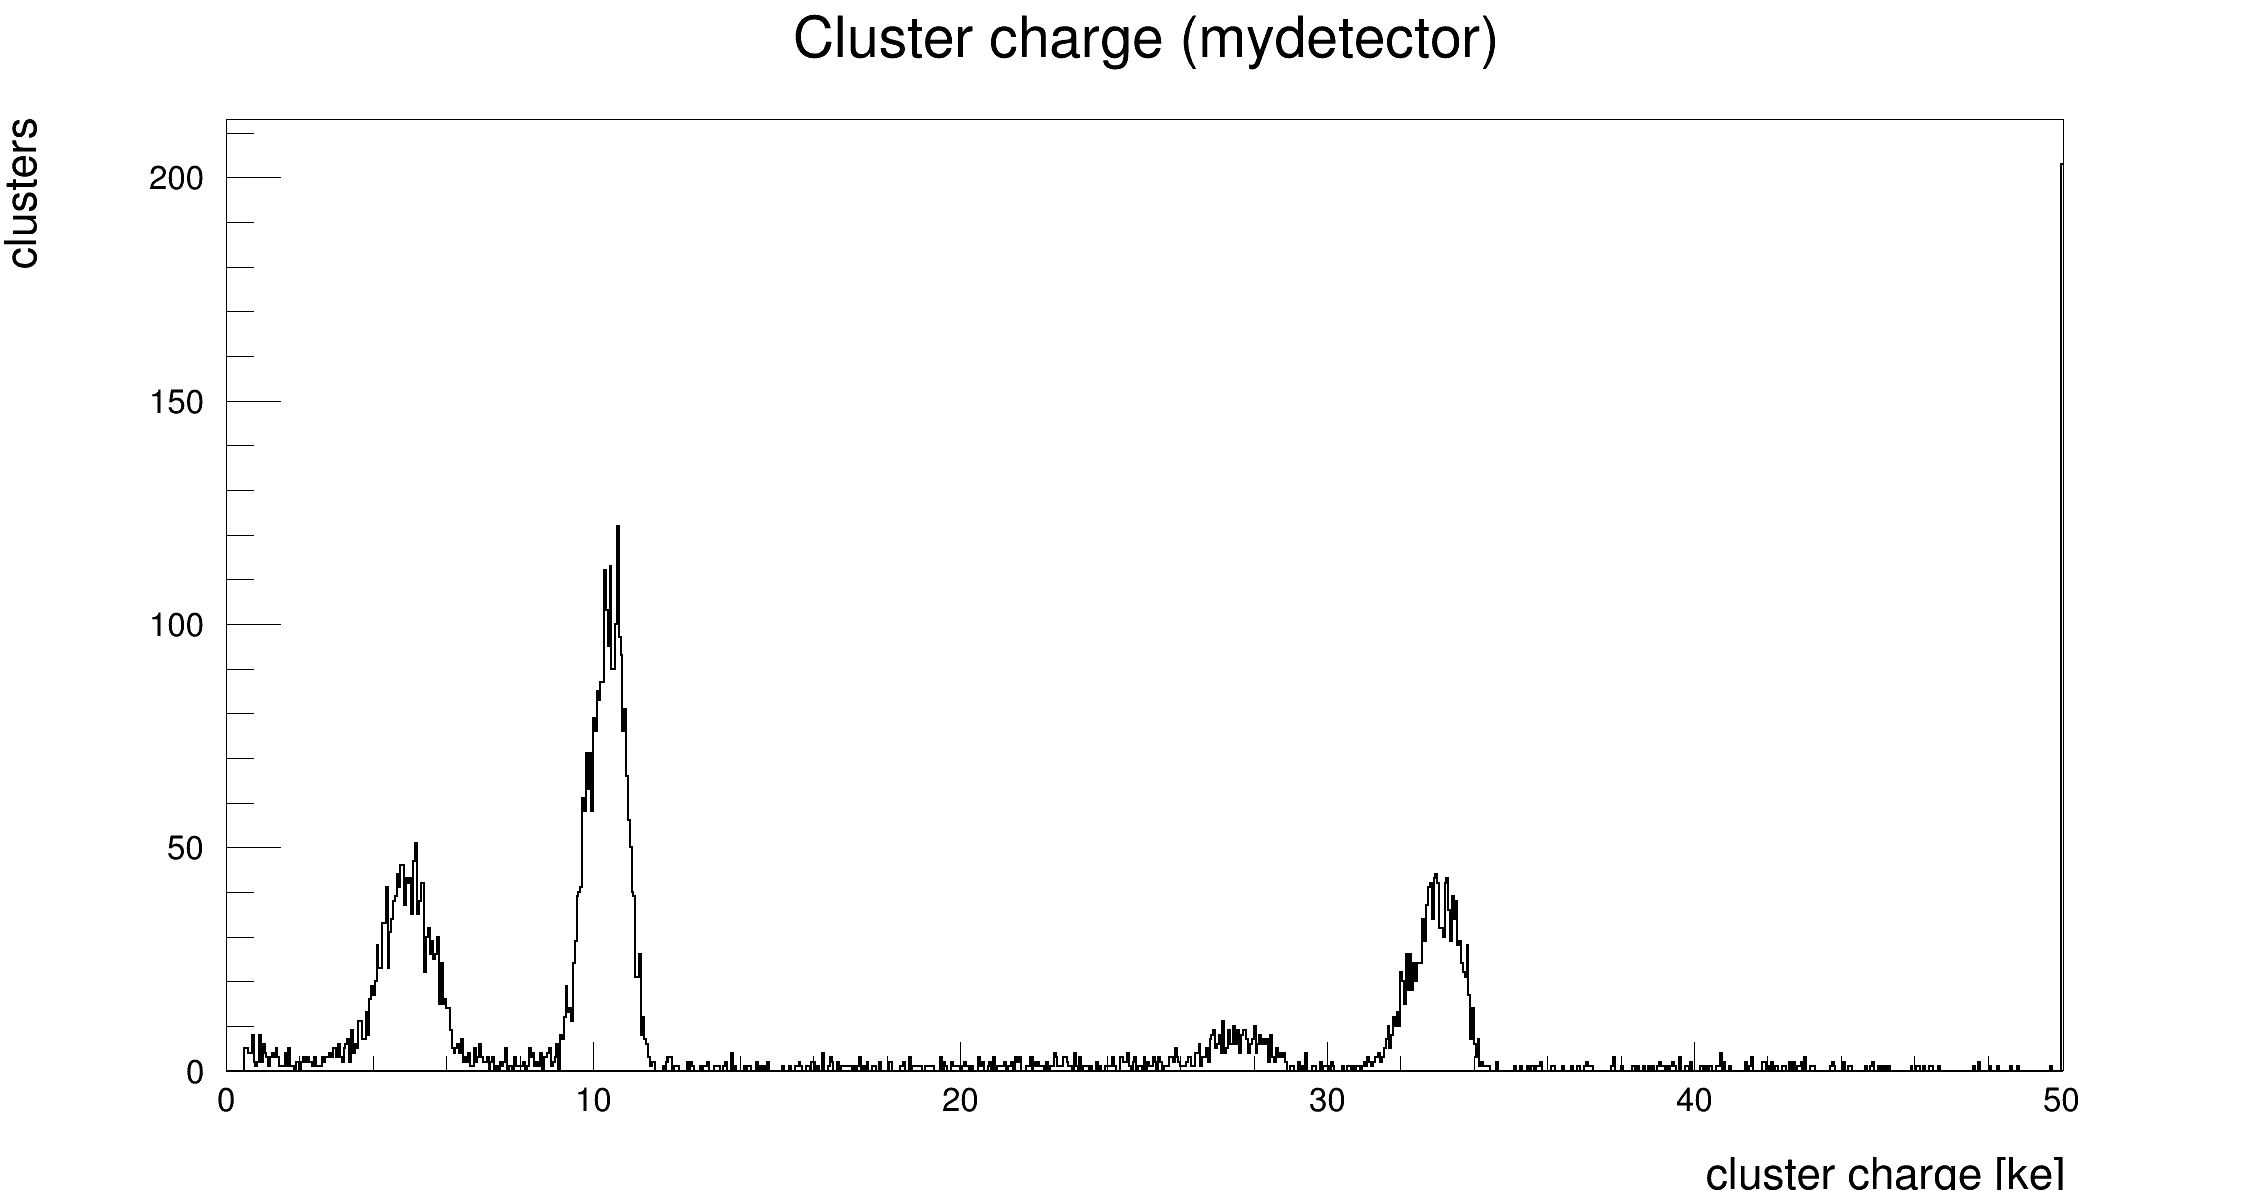
I’ve had a bit of a look! I ran with `[DefaultDigitizer]`, and I get this for the cluster charge:
And this is quite alright; at least two peaks at expected locations of 11 ke and 34 ke.
Extending the range a bit using max_cluster_charge = 90ke in `[DetectorHistogrammer]` we also see the last peak, at 79 ke.
Now, this really does not turn up in your `[CSADigitizer]`, so I think the tuning of its parameters are just not sufficient to capture the full spectrum.
When I run it without setting a ToT clock I can (largely) recover the spectrum also with the CSADigitizer;
Arbitrary units here on the x-axis.
So the issue is in the actual ToT. Digitizer settings, or the fact that you only have approximate pulses (which can make the pulses themselves “peaky”, going from something to zero and back, and this can mess with the ToT).
Kind regards,
Håkan
1 Like
@hwennlof Thank you for your insight! From my understanding there is just such small pulses that the tot clock cycle does not have a fine enough resolution to represent the spectrum?
I do have a couple of questions regarding your answer. You mentioned that there were two peaks at expected locations of 11 ke and 34 ke. Are these peaks unique to the CdTe material?
Would you mind explaining the incomplete pulses? It sounds like I need to provide more time to capture the pulse to fully capture the signal.
Thank you!
@hwennlof When running the CSADigitizer without a ToT clock value I cannot reproduce your plot. I just get an empty plot using the DetectorHistogrammer and observing the cluster charge tree in the root file. What were the adjustments you made to produce the last plot if you don’t mind sharing, I would really appreciate it!
Hi @oobie2142 ,
Indeed, it might be that the clock cycle is not fine enough, or that the pulses go above threshold and then below again. Pulses at the moment (when using [GenericPropagation] and [PulseTransfer]) are approximated by using the time of arrival of individual charge carrier groups. This can lead to a “peaky” pulse.
Having a look at some pulsegraphs from the [PulseTransfer] and [CSADigitizer] modules might show this. It could also be that the threshold is too high compared to the pulse, so I advise looking at some pulsegraphs by adding output_pulsegraphs = true.
Now, the two peaks I mentioned: they come from just using the two lower of the energies and dividing by the charge_creation_energy of 4.43 eV.
The lower peaks to the left of the main ones I can imagine being from escape events (see here for example), where a Cd or Te x-ray escapes. The Cd K-alphas are at around 23 keV, which would correspond to around 5200 electrons, which about matches the distance between the peaks.
Also, for getting that last histogram, you’re right! I did a thing which I then forgot about.
The thing is, what we get out as “charge” from the CSADigitizer is the accumulation of the voltage pulse. This will be proportional to the collected charge, but the unit is funky (mV*s), and the end result is negative as your pulse is negative. This is why the histogram is empty (it has entries, but all in underflow), and this is why I pointed out that it’s “arbitrary units” in the final plot I showed. So, what I did was take the absolute value and multiply it by a factor, just to fit it within a sensible range in the histogram (lazy, I know, but it was just a quick check).
In more detail what I did was add a line at L373 in [CSADigitizer] to redefine the charge as its absolute value multiplied by 100000. Another way would be to do it in [DetectorHistogrammer].
But note that this is just for a check. It’s proportional to charge, but it is not charge in sensible units.
Kind regards,
Håkan